What is a Time-Distance Diagram in Linear Project Management?
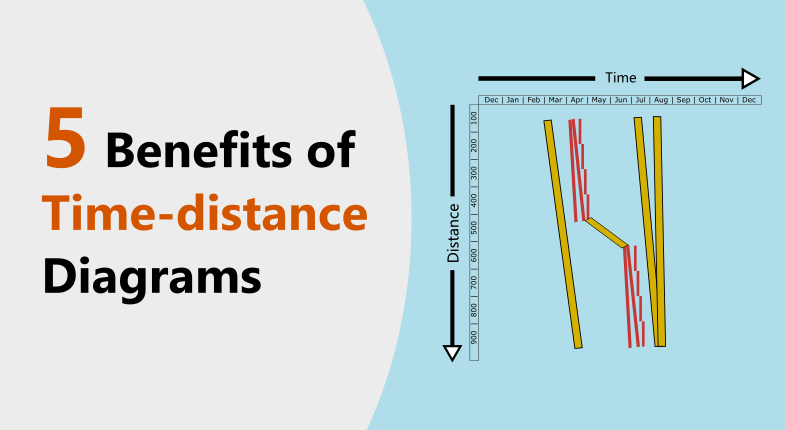
In linear project management, a Time-distance diagram or often termed a linear schedule is a project management tool to present a time schedule in two dimensions i.e. time and distance.
This is normally used for linear projects, i.e. the projects which have linear construction properties or repetitive construction tasks such as the construction of roads, bridges, tunnels, airport runways, high-rise buildings, pipelines, railways, and electrical transmission lines.
The diagram represents the location or length of the project and the time at which a certain crew will be working on a given task.
Time is normally represented at the vertical axis from the top (start of project) to bottom (end of the project) and the location or distance at the horizontal axis.
Activities are represented as sloping lines based on the start and end coordinate (locations) with respect to time.
In contrast to the traditional method of the Gantt chart, the time-distance diagram shows not only the location of the activity but also the direction of progress and the progress and production rate.
Adding the location-specific schematics, photos and cross-sectional views is an added advantage to practically visualize the schedule for more understanding.
Benefits of Time-Distance Diagram in Linear Project Management
Although traditional CPM or Gantt chart schedules are widely used in project management organizations and are a very good way of developing and reporting schedules. However, Gantt charts are not that effective in the case of linear projects.
In contrast, the time-distance diagrams are the best tool for such projects to easily plot and detail the project, highlight trends and issues with better clarity and visibility for the field team and management.
Some of the salient benefits of using time-distance diagrams over CPM schedules are detailed below;
1. Easy and Convenient
One of the main benefits of the time-location diagram is ease.
For a similar scope of the project, the Gantt chart requires a number of pages and effort to come up with the schedule and that too with not the complete visibility.

As much confusing to go through the whole Gantt chart, often the management request another brief schedule to understand the main schedule. And if some modification is required at any level, this becomes a cumbersome process.
While on the other side, a time-location diagram is easy to develop and revise with much lesser effort than creating the traditional schedules.
As the project progresses, the reporting is also much easy with the time-location diagram than going through the percent completion of a number of activities and WBS’s on a large number of pages.
Time-distance diagrams have the added advantage to overview the progress at any location, issues and constraints, productivity rates, future forecasts, and everything that a field supervisor or the management requires, and that all in just one view.
In a nutshell complex linear projects are easy and convenient to create, easy to report, and easy to understand with the time-distance diagram than CPM Gantt charts.
2. Improved Communication
One of the greatest strengths of the time-distance diagram is its visualization features and ease of communication for linear projects.
Effective Communication is the key to successful project completion thus ranks very high among the project manager’s objectives.

Communicating with the key stakeholders and subcontractors becomes very challenging when the project manager is not aware of the latest developments, constraints, and issues from the complex CPM schedules.
Gantt chart schedules make it really difficult to communicate the project progress and status of a number of activities in the fast pace of the construction environment.
A Time-distance diagram is much helpful to cater to these issues by addressing all the concerns in a simple and easy-to-understand way by communicating where work is going on, historical trends, productivity rates at various segments, and future requirements thus avoiding any confusion from the unclear communications.
The road towards the success of the project becomes even smooth when the field staff and management are all on the same page through the convenient way of presentation and coordination with the time-distance diagrams.
Did You Know…
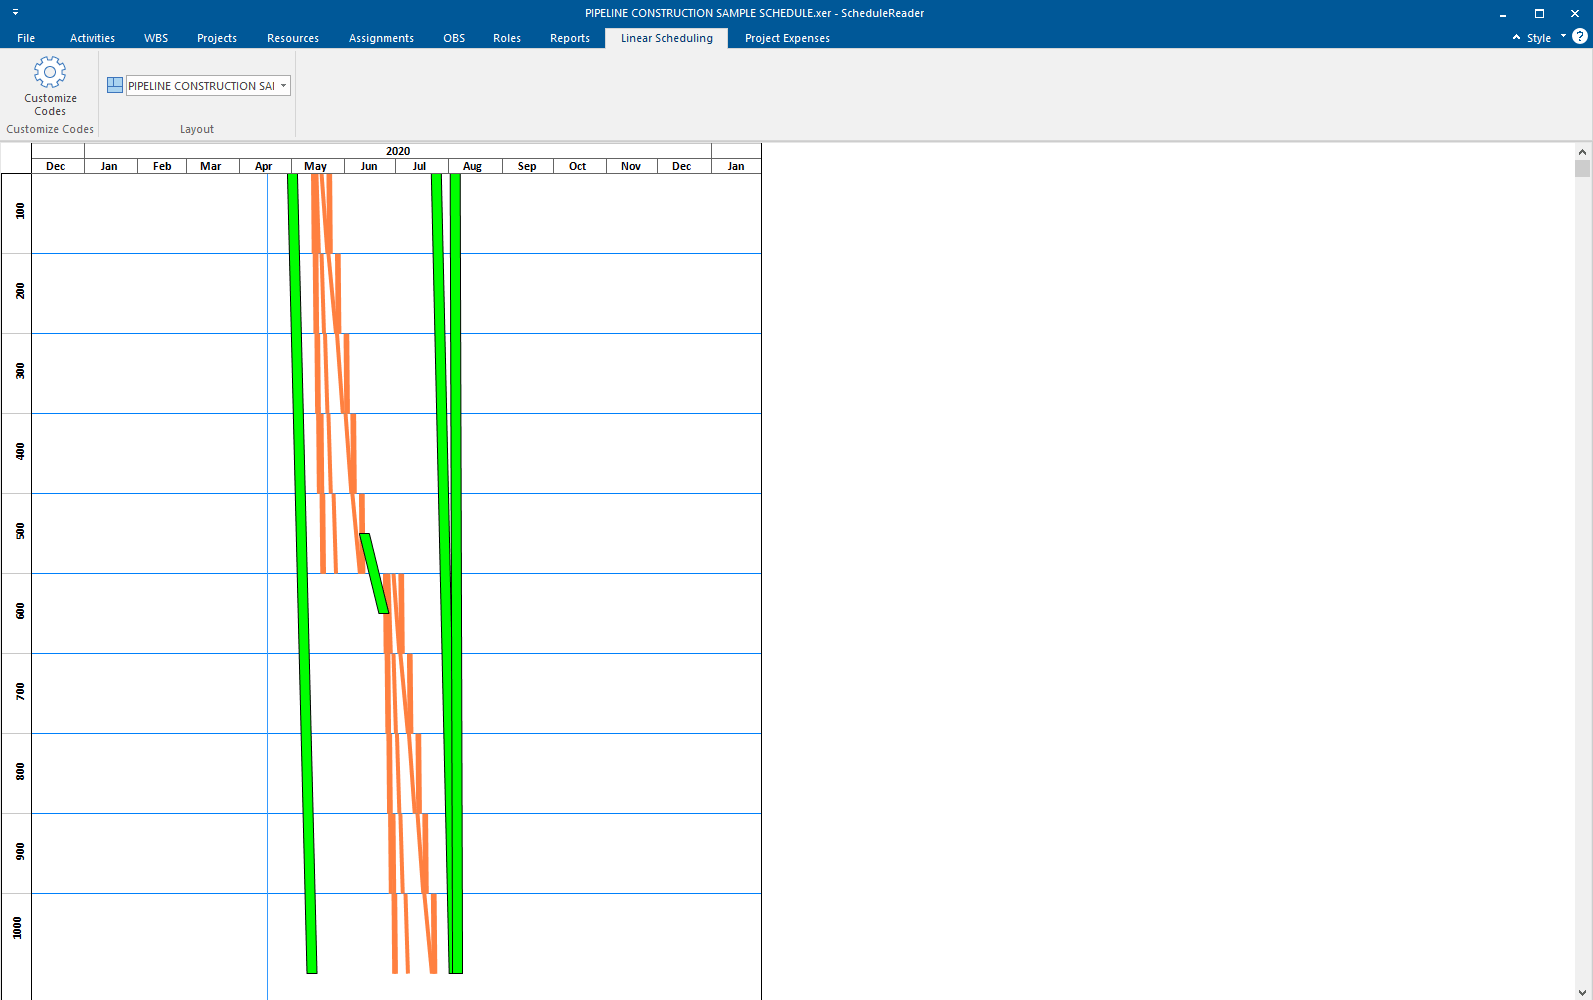
ScheduleReader can present time-distance diagrams in the Linear Scheduling view.
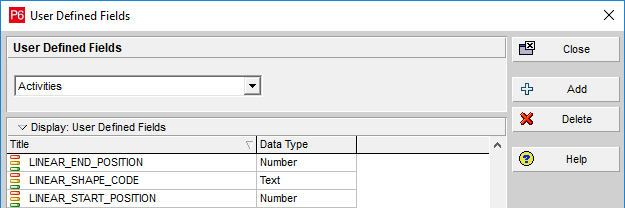
In order to view the project plans with the Time-Location diagram in ScheduleReader, the project scheduler must ensure that the following three user-defined fields (UDF) are created in the schedule:
- Two fields (data type: Number) for starting and ending point of the activity;
- One field (data type: Text) for the activity shape.
3. Risk Identification and Analysis
Risks either opportunities or threats have a great impact on the successful project completion.
A well-planned and thorough schedule plays an important part in the timely identification and analysis of risks associated with the project.

As to reflect the entirety of the overall project scope in just one view and the simplicity, associated risks become more apparent to identify at early stages of planning compared to pages and pages of complex network schedules. The impact of early identified threats can be reduced significantly by addressing them timely and keeping a buffer in the schedule.
On the other hand, any opportunities developed during the execution process get highlighted during monitoring and reporting with the time-distance diagram thus an added advantage for the project managers to accelerate the schedule.
Even if any unforeseeable circumstances take place during the execution phase, sequencing of activities and productivity rates can be revisited easily to reduce the inefficiencies and speed up the project.
The Time-location diagram is also very beneficial as an As-built document for extension of time claims as it presents all the historical trends and bottlenecks encountered during the execution of the project.
4. Less Resources
In order to have a full implementation, a number of planners and schedulers are required to work in a team for the development and maintenance of the complex CPM schedules whereas this number is reduced significantly with the use of linear scheduling methods for the same scope and details of the project.
Normally a single person can handle a medium-sized project with the time-location diagramming method. Apart from the number of resources, the expertise level requirement of planners for the time-location diagram scheduling is less and even junior staff can take up the responsibilities with little assistance from the management.

Both of these factors significantly reduce the cost burden to the overall budget of the project and thus avoiding cost overrun while having improved planning, monitoring, and reporting standards.
5. Effective Decision Making in Linear Project Management
A timely taken decision could save the project or ruin otherwise.
As the leader of the project, the project manager needs to have a clear vision and understanding to decide the fate of the project.
As the time-location method is easy to understand and interpret the historical performance, it highlights the lapses of each task with its historical performance and future forecast and subsequently helps the project manager to take timely preventive or corrective action rather than going through the complex network of CPM schedules.
As an example, the time-location diagram is very easy to understand the sequencing of interrelated activities. A slippage or advancement of one activity impacts the successors and requires the immediate attention of the project manager.
Any delay in material delivery suggests the mobilization of heavy equipment needs to be postponed to avoid any idling cost or on the other hand, any early arrival of material at the field may trigger the requirement for the early mobilization of heavy equipment at the field for early completion of the project.


The project manager relies very much on the scheduling sequences for such decisions to clearly see the impact of one activity on the overall project, both in terms of schedule and cost.
Having such information readily and accurately available in an easy to understand and interpret way, a time-location diagram saves much of the project manager’s energy and time for the right decision at right time.
6. Organizational Standards & Future Projects
One of the benefits of using the time-location diagramming method is helping to develop productivity norms and performance standards.
Past performance and productivity data are collected from the time-location diagram for all the tasks at various working conditions to develop organizational standards.

The same is then applied for the estimation of similar future projects.
This helps to develop a realistic bid estimation catering to all the gaps and lessons learned from the past and thus ensuring an optimum and winnable estimate.
Conclusion – Linear Project Management with Time-Location Diagram
For the complex linear projects, the overall planning and reporting process is facilitated and simplified using time-distance diagrams, as it is more visual and intuitive compared to complex Gantt chart schedules.
If the time-location diagram is properly developed and maintained, it helps the project manager as well as all levels of field staff for a better and detailed understanding of the whole project schedule, prerequisites, and the driven factors.
For a field supervisor level, a better and detailed understanding means a complete insight of work going on at various tasks and next available work fronts for better utilizing the project resources.
For a project manager, a better and detailed understanding results in the right decision making, team management, schedule and cost management, and ultimately the successful completion of the overall project.