


Earned Value Management Calculations and EVM Formulas
Earned Value Management (EVM) is the measurement technique that lets project managers and controls measure project performance and progress against cost and schedule. It finds variances by comparing work planned with work performed, which gives schedulers, controls and managers the big picture: project scope, actual and budgeted costs, and performance in a single view. EVM also drives forecasting, comparing how much work is complete against how much was expected by a given date, and predicting future outcomes objectively.
This article covers the basic EVM formulas and calculations and how they work in Primavera P6.
All the EVM formulas at a glance
| Term | Formula | What it tells you |
|---|---|---|
| Planned Value (PV / BCWS) | Sum of planned costs to date (from the baseline) | The authorized budget for scheduled work |
| Actual Cost (AC / ACWP) | Sum of costs incurred | Money actually spent on work done |
| Earned Value (EV / BCWP) | EV = BAC × % Complete | The value of work actually completed |
| Budget at Completion (BAC) | Total project budget | The planned total cost |
| Schedule Variance (SV) | SV = EV − PV | Ahead (positive), behind (negative), or on schedule (zero) |
| Schedule Performance Index (SPI) | SPI = EV / PV | Schedule efficiency: above 1 is ahead, below 1 is behind |
| Cost Variance (CV) | CV = EV − AC | Under (positive), over (negative), or on budget (zero) |
| Cost Performance Index (CPI) | CPI = EV / AC | Cost efficiency: above 1 is under budget, below 1 is over |
| Estimate at Completion (EAC) | EAC = BAC / CPI (typical) | Forecast total cost at completion |
| Estimate to Complete (ETC) | ETC = EAC − AC | Cost still needed to finish |
| Variance at Completion (VAC) | VAC = BAC − EAC | Projected surplus (positive) or overrun (negative) |
| To-Complete Performance Index (TCPI) | TCPI = (BAC − EV) / (BAC − AC) | Efficiency needed on remaining work to hit the budget |

Earned Value Management formulas explained
Comparing actual expenditures alone cannot tell you where a project stands. Monitoring a project means knowing whether its activities are on, ahead, or behind schedule and on, under, or over budget, which is where EVM comes in. As a project control, scheduler or project manager, you need to know the formulas below and the situations each one fits.
Stop wrestling with Primavera XER schedules.
Your team can see your schedule without buying a P6 license.
Start Free Trial No credit card · Windows & Mac · From $344/yr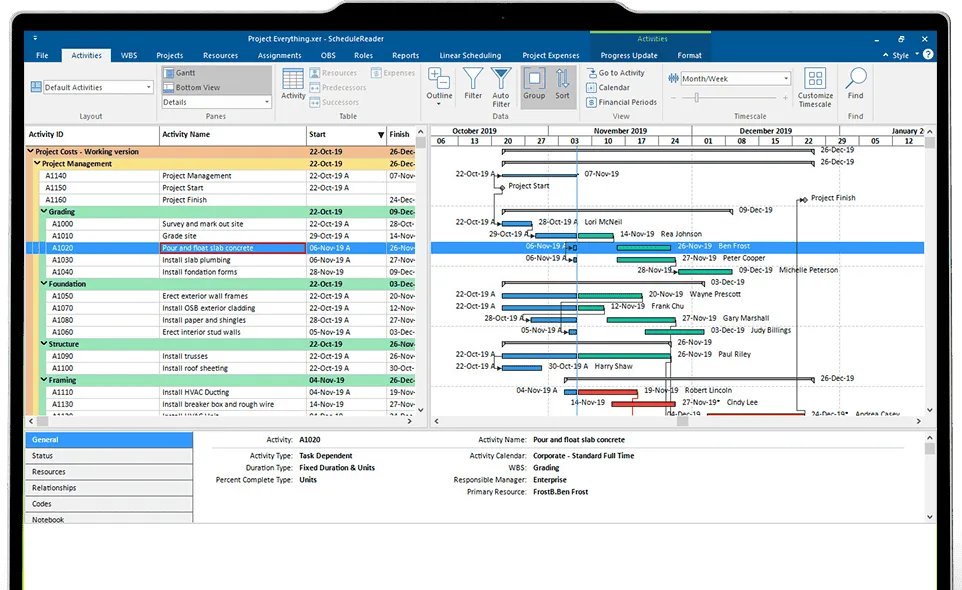
Planned Value (PV)
Planned Value is the approved budget for work scheduled to be completed by a certain date. Unlike Earned Value, it is proactive: it shows how much you should have spent by that date. It is also called Budgeted Cost of Work Scheduled (BCWS). To find the PV at any point, add up all planned costs to that point, referenced from the project’s baseline.
Actual Cost (AC)
Actual Cost is the realized cost for the work performed on an activity in a given period. It shows the money spent on an activity over that time, and it is also called Actual Cost of Work Performed (ACWP). Actual Cost is an increasing value that grows as the project progresses.
Budget at Completion (BAC)
Budget at Completion is the sum of the total budgets expected to be spent on the performed work. It shows how much money was initially planned for the project, and it is the total project budget summed from all task budgets.
BAC = Total Project Budget
Earned Value (EV)
Earned Value is the amount of work actually completed, expressed as the value of the performance budget assigned to that work. In construction it is also called the Budgeted Cost of Work Performed (BCWP), and it is calculated as BAC multiplied by the percent of work completed.
EV = BAC × % Complete
For example, at 30% complete with a budget of $10,000, EV is $3,000.
Schedule Variance (SV)
Schedule Variance is the difference between where you planned to be and where you actually are. It tracks whether the project is behind, ahead, or on schedule, and it is the difference between Earned Value and Planned Value.
SV = EV − PV
| Result | Meaning | Example |
|---|---|---|
| Negative | Behind schedule: less work done than planned | EV $3,000 − PV $3,500 = −$500 |
| Positive | Ahead of schedule: more work done than planned | EV $3,000 − PV $2,000 = +$1,000 |
| Zero | On schedule | EV $3,000 − PV $3,000 = $0 |
Schedule Performance Index (SPI)
Schedule Performance Index shows the rate at which performance is meeting schedule expectations up to a point in time, giving the manager the overall schedule efficiency. It is Earned Value divided by Planned Value.
SPI = EV / PV
| Result | Meaning | Example |
|---|---|---|
| Below 1 | Behind schedule | EV $3,000 / PV $3,500 = 0.85, so the work is 15% behind plan |
| Above 1 | Ahead of planned progress | EV $3,000 / PV $2,500 = 1.2, so the work is 20% ahead of plan |
| Equal to 1 | On schedule | EV $3,000 / PV $3,000 = 1.0 |
A caveat worth knowing: an SPI above 1 means more work was accomplished than planned, but it does not automatically mean the project is ahead in the sense of finishing early. The extra work may be off the critical path. Read SPI alongside the critical path before treating it as good news.
Cost Variance (CV)
Cost Variance is the difference between what was planned to be spent and what was actually spent. It shows how far a task is over, under, or on budget, and it is Earned Value minus Actual Cost.
CV = EV − AC
| Result | Meaning | Example |
|---|---|---|
| Negative | Over budget | EV $3,000 − AC $3,500 = −$500 |
| Positive | Under budget | EV $3,000 − AC $2,500 = +$500 |
| Zero | On budget | EV $3,000 − AC $3,000 = $0 |
Cost Performance Index (CPI)
Cost Performance Index is the rate at which performance is meeting planned costs in a period. It shows not only how much money is being spent to deliver the project but how well that money is spent, and it is Earned Value divided by Actual Cost.
CPI = EV / AC
| Result | Meaning | Example |
|---|---|---|
| Below 1 | Over budget | EV $3,000 / AC $3,500 = 0.85, so cost is 15% over plan |
| Above 1 | Under budget | EV $3,000 / AC $2,500 = 1.2, so cost is 20% under plan |
| Equal to 1 | On budget | EV $3,000 / AC $3,000 = 1.0 |
Estimate at Completion (EAC)
Estimate at Completion shows the expected total cost when all tasks are complete, based on performance to a point in time. There are several ways to calculate it, and the right one depends on what you assume about the remaining work.
| Situation | Formula |
|---|---|
| Current cost performance is expected to continue (typical) | EAC = BAC / CPI |
| Remaining work is expected to proceed at the planned rate (atypical) | EAC = AC + (BAC − EV) |
| The original estimate is no longer valid (bottom-up re-estimate) | EAC = AC + ETC |
| Future performance is influenced by both cost and schedule | EAC = AC + [(BAC − EV) / (SPI × CPI)] |
Estimate to Complete (ETC)
Estimate to Complete shows how much more money is needed to finish the remaining work, based on past performance. To calculate it, subtract Actual Cost from Estimate at Completion.
ETC = EAC − AC
Other ways to estimate ETC, depending on assumptions, include ETC = BAC − EV (finish at the planned rate), ETC = (BAC − EV) / CPI (continue current cost performance), and ETC = (BAC − EV) / (CPI × SPI) (influenced by both cost and schedule performance). You will need a different calculation if past performance is expected to change.
Variance at Completion (VAC)
Variance at Completion projects the budget surplus or shortfall at project completion, calculated as the difference between Budget at Completion and Estimate at Completion.
VAC = BAC − EAC
| Result | Meaning | Example |
|---|---|---|
| Negative | More money needed to finish | BAC $20,000 − EAC $25,000 = −$5,000, so an extra $5,000 is needed |
| Positive | Budget surplus | BAC $20,000 − EAC $18,500 = +$1,500, so the project finishes with $1,500 spare |
To-Complete Performance Index (TCPI)
To-Complete Performance Index shows the performance that must be achieved on the remaining work to meet the budget (or a target). It indicates how much efficiency must be gained to make up for past negative variances.
| Target | Formula |
|---|---|
| Finish within the original budget | TCPI = (BAC − EV) / (BAC − AC) |
| Finish within a revised budget (EAC) | TCPI = (BAC − EV) / (EAC − AC) |
A TCPI above 1 means the remaining work must be executed more efficiently than originally budgeted, and the further above 1 it climbs, the harder the recovery.
The importance of EVM in Primavera P6
Earned Value Management is now part of all major project portfolios. Many project management software solutions exist, but not all can deliver the variances you need. Without an integrated earned value process, troubled projects can slip out of control before anyone sees a problem. Primavera P6 has fully integrated EVM functionality, which lets users join cost and schedule information into a single solution and generate the statistically accurate estimates needed to communicate project performance.
EVM in P6 delivers detailed cost information alongside the project schedule by aligning and combining performance data from costs, adding complex burdening rates, and tracking committed costs. One of the most important benefits is that earned value updates become dynamic in parallel with the schedule logic. When the schedule is synchronized with EVM in the software, it provides a dynamic view that lets teams build forecasts that can save a project.
EVM also exposes poor scheduling or an inability to deliver a good plan, and it provides insights into a project’s current cost and schedule status that help project managers balance cost, schedule and scope.
Earned Value Management in ScheduleReader
Primavera P6 is a costly tool, and only a few people on the project team really need it. Those who are not schedulers can review the schedule with a standalone solution that opens project data from Primavera P6: ScheduleReader.
ScheduleReader includes Earned Value Analysis as a fully integrated function. It cuts P6 licensing cost while giving you a complete XER reader with synchronized Earned Value Management.
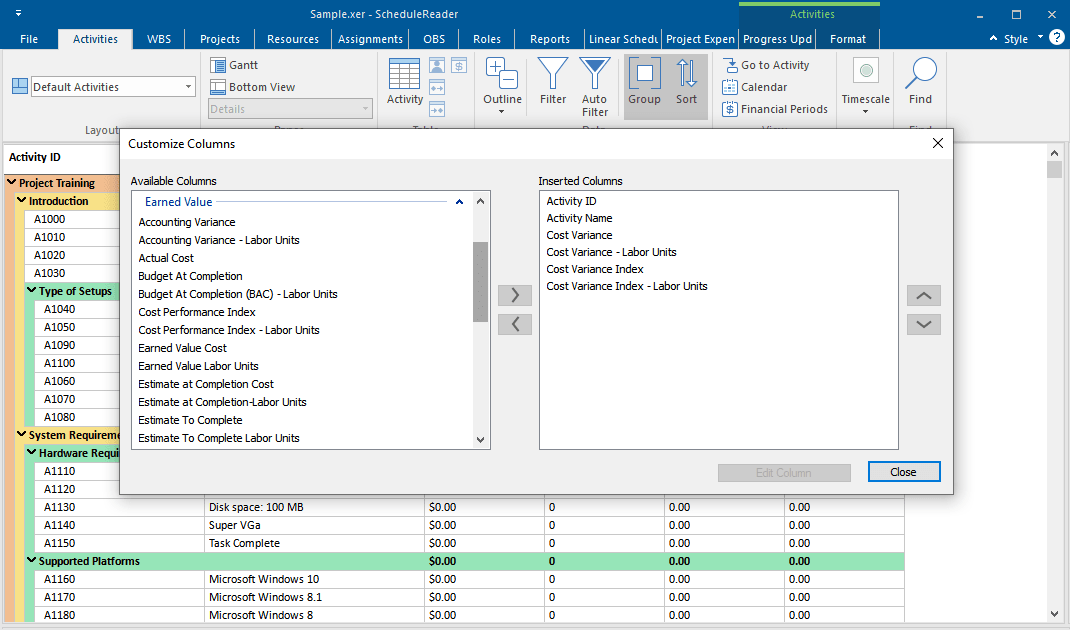
ScheduleReader works from the project’s baselines as the foundation for calculating Earned Value, using the P6 default settings, and the values are available in the Activity View. You can create layouts with specific EVM formulas and EV cost, work and time parameters, or import layouts exported from P6.
ScheduleReader delivers the three most important benefits of Earned Value Management:
- The right point on where you are in the project to date
- Forecast future performance, costs and completion dates
- Maintain control and deliver on time and on budget
ScheduleReader PRO also lets users analyze different EV parameters and summarize them in graphical reports for a clearer view.
Frequently asked questions
What is the basic EVM formula?
The core formulas are EV = BAC × % Complete, SV = EV − PV, SPI = EV / PV, CV = EV − AC, and CPI = EV / AC. Forecasting formulas build on those: EAC = BAC / CPI, ETC = EAC − AC, and VAC = BAC − EAC.
What does an SPI of 0.85 mean?
An SPI of 0.85 means the project has accomplished 85% of the work planned for that point, so it is 15% behind schedule. The shortfall is 1 minus the SPI, not the index itself.
What does a CPI of 1.2 mean?
A CPI of 1.2 means the project earns $1.20 of value for every $1.00 spent, so it is 20% under budget on cost efficiency.
Which EAC formula should I use?
Use EAC = BAC / CPI when current cost performance is expected to continue, and EAC = AC + (BAC − EV) when remaining work is expected to proceed at the planned rate. Use EAC = AC + ETC when the original estimate is invalid and you re-estimate bottom-up, and EAC = AC + [(BAC − EV) / (SPI × CPI)] when future performance is influenced by both cost and schedule.
Does SPI above 1 always mean ahead of schedule?
No. An SPI above 1 means more work was accomplished than planned, but that work may be off the critical path, so it does not guarantee the project finishes early. Check the critical path before concluding the project is ahead.
Can I calculate earned value without Primavera P6?
You need a P6 license to build and maintain the schedule, but you can view and analyze earned value from a schedule exported as XER or XML using a standalone tool such as ScheduleReader.