Create and Share Dynamic Graphical Reports From Primavera P6 XER Schedules
Meaningful Reporting With The New ScheduleReader PRO
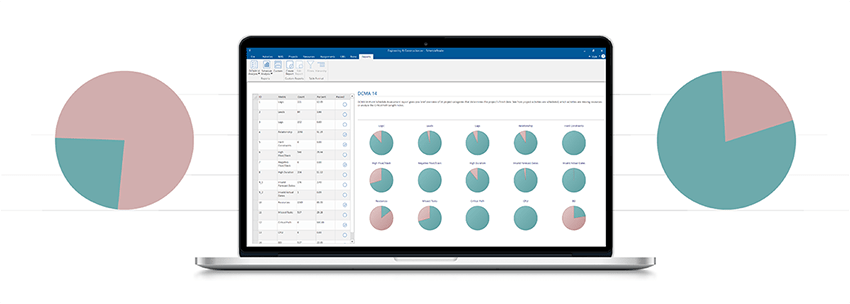
The Pro version of ScheduleReader features dynamic reports and dashboards, which summarize project information in a clear visual and easy to understand graphics.
The graphical reports allows project managers, schedulers and other stakeholders to quickly get business critical project information which helps them make more informed decisions.
ScheduleReader offerse two types of reports:
- Predefined Reports & Dashboards
- Custom Graphical Reports
Predefined Reports & Dashboards
ScheduleReader PRO features predefined graphical report templates that give overall information about the status of the project plan. These report templates help users quickly create report with particular project parameters. The Predefined graphical reports are divided into the following groups: DCMA 14 based and reports classified in the three Activity, WBS and Project categories.
DCMA 14 Analysis Based
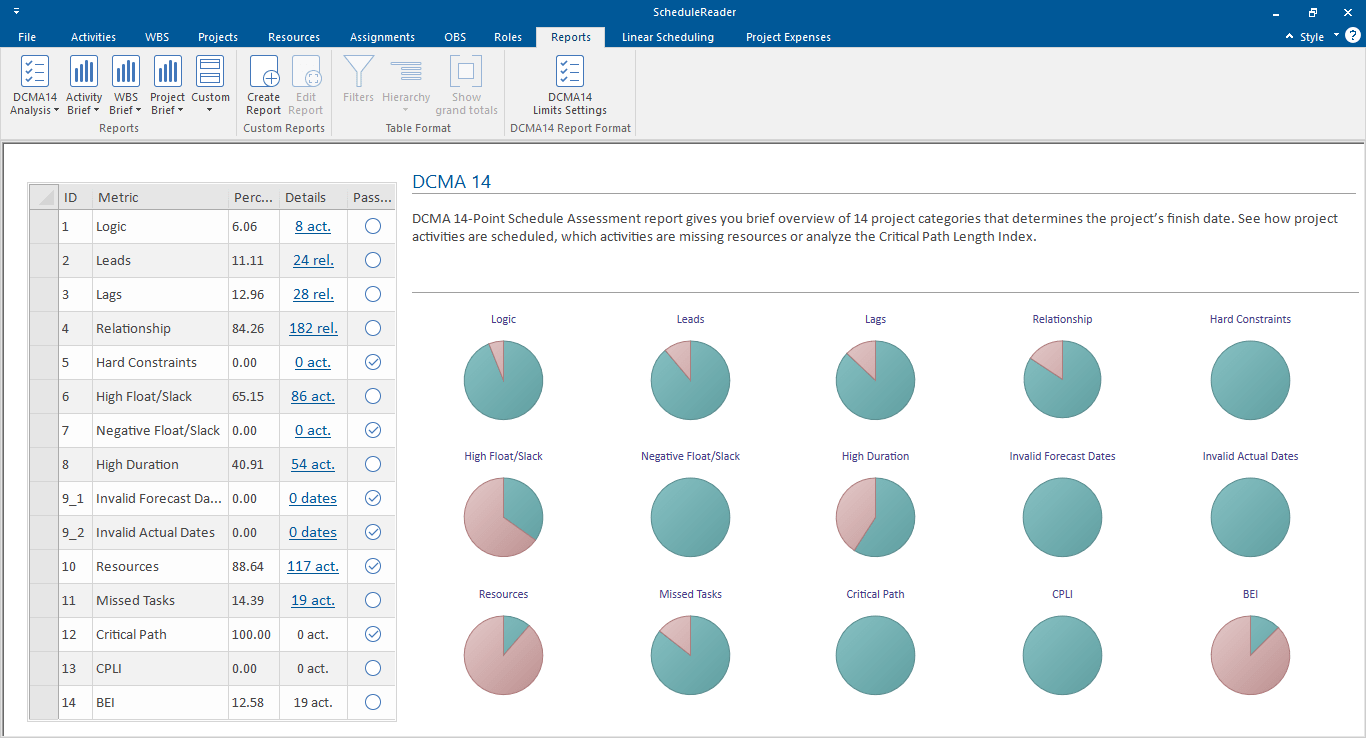
- DCMA 14 Schedule Analysis;
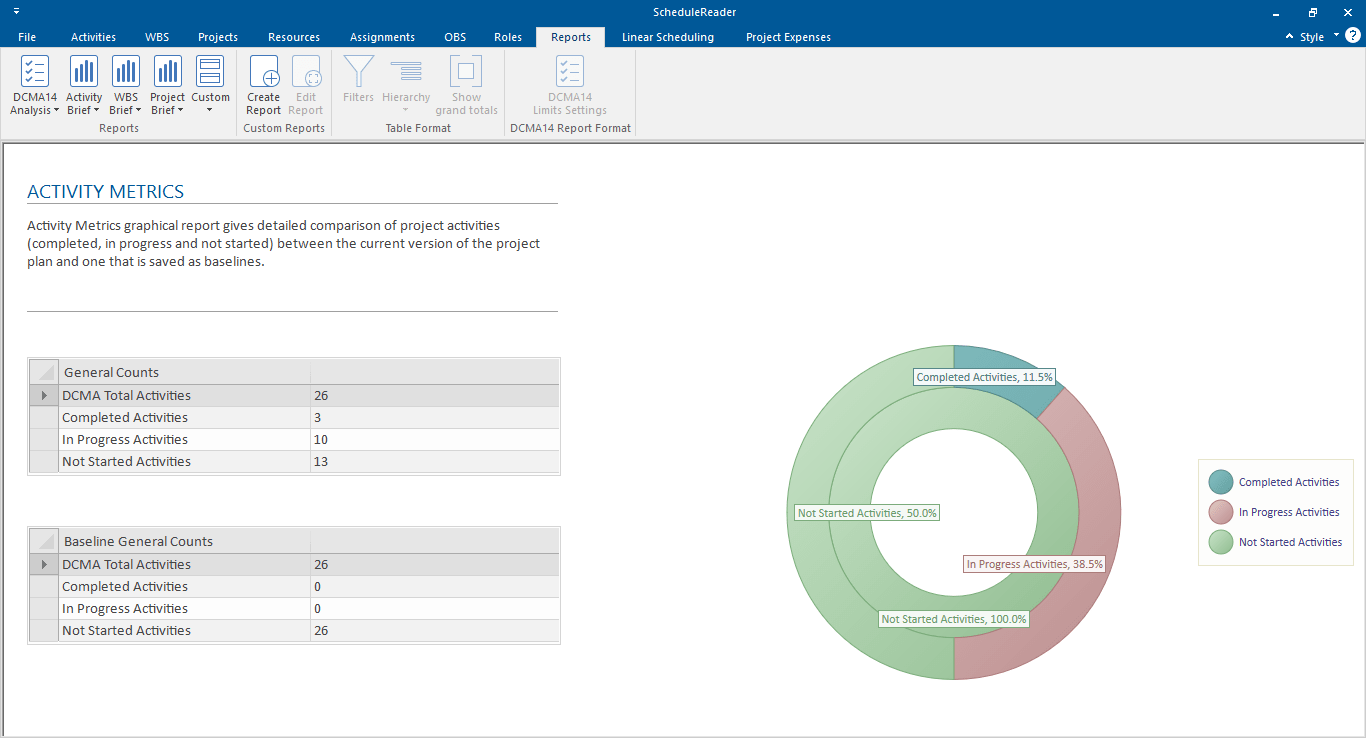
- Activity Metrics;
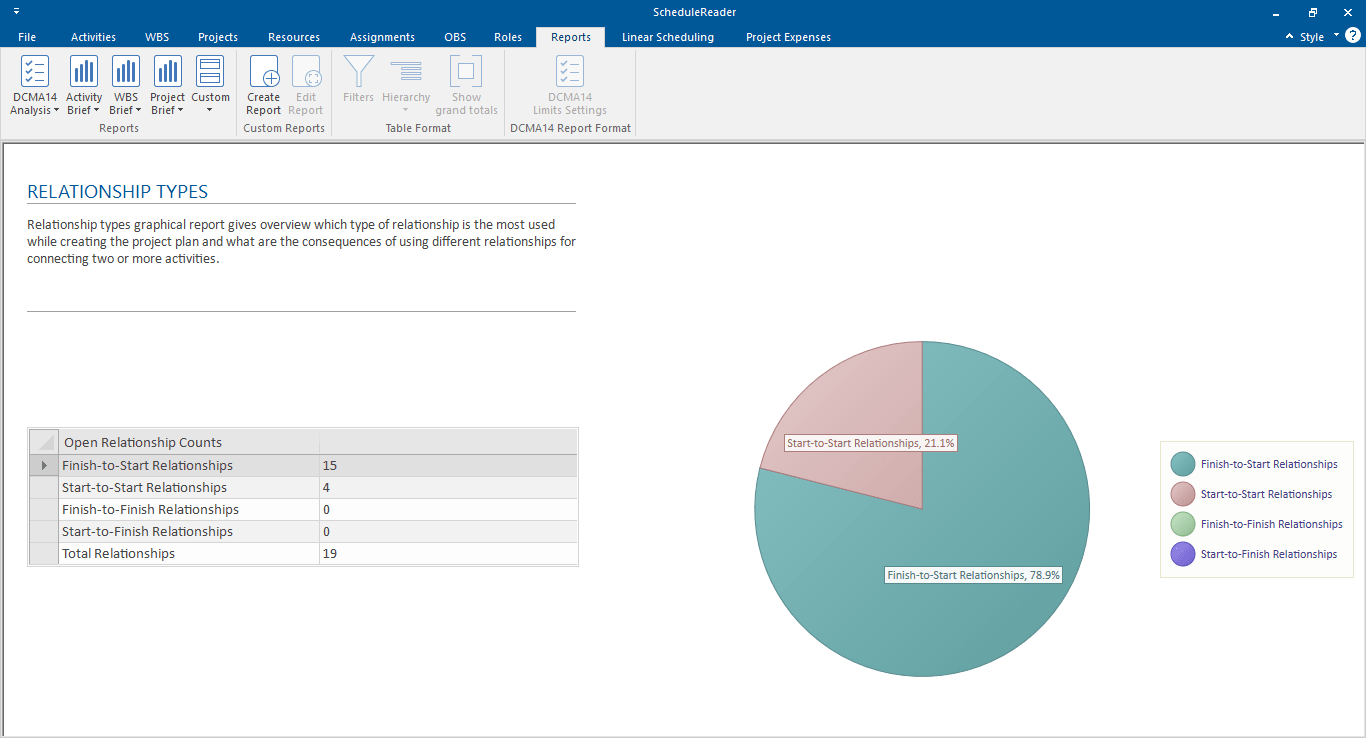
- Relationship Types;
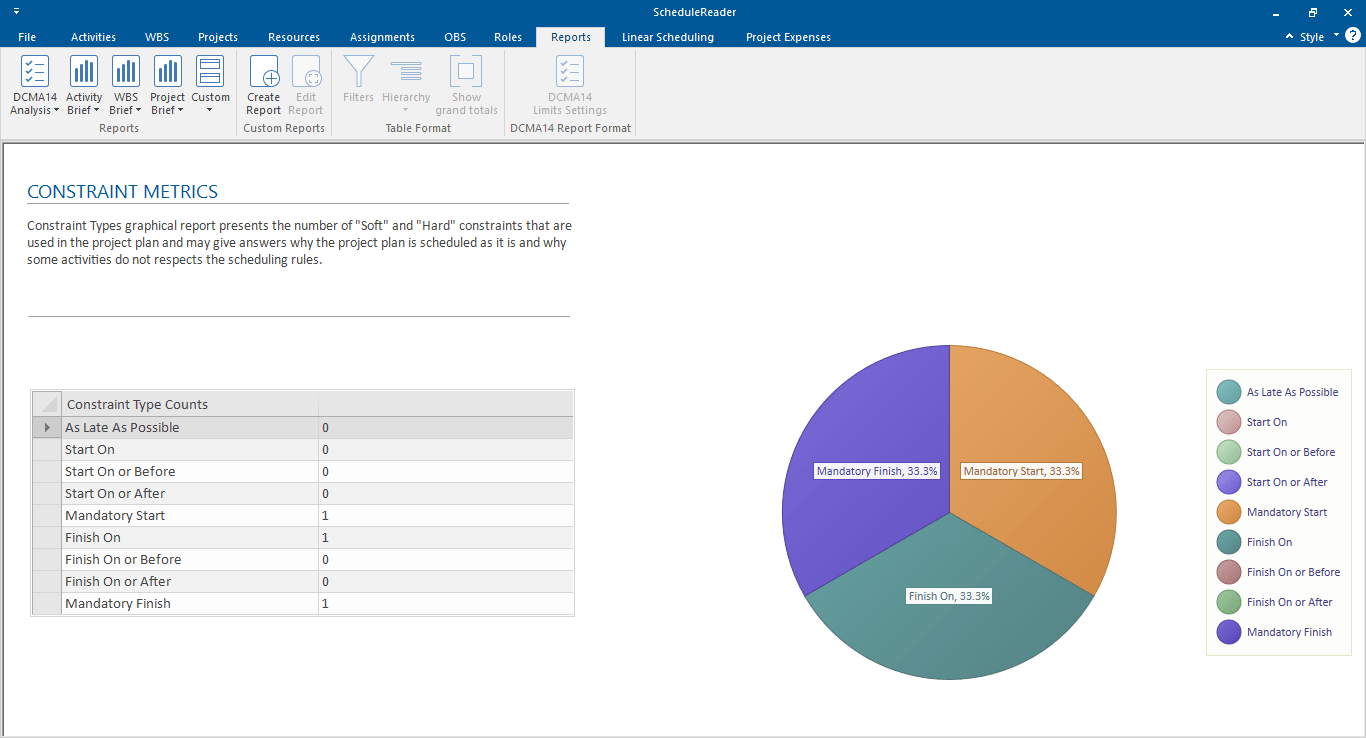
- Constraint Types.
Activity Overview
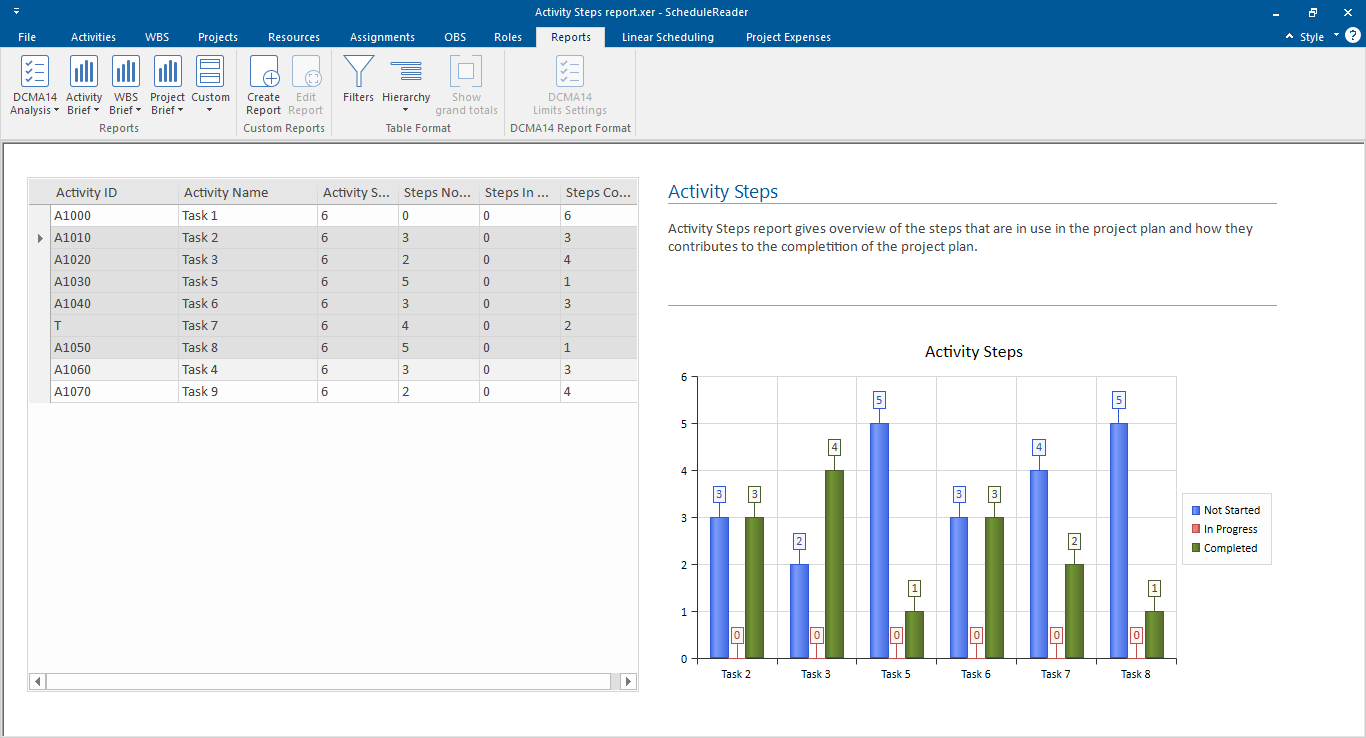
- Activity Steps;
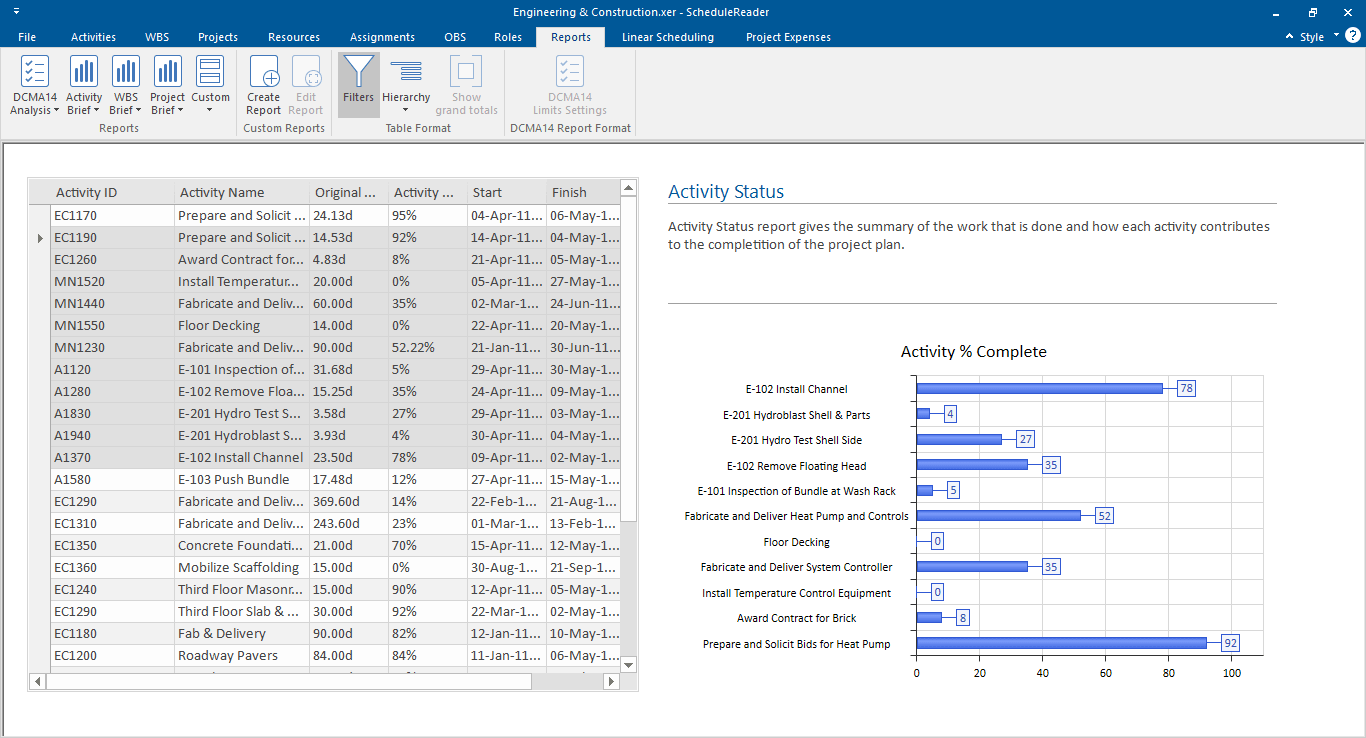
- Activity Status;
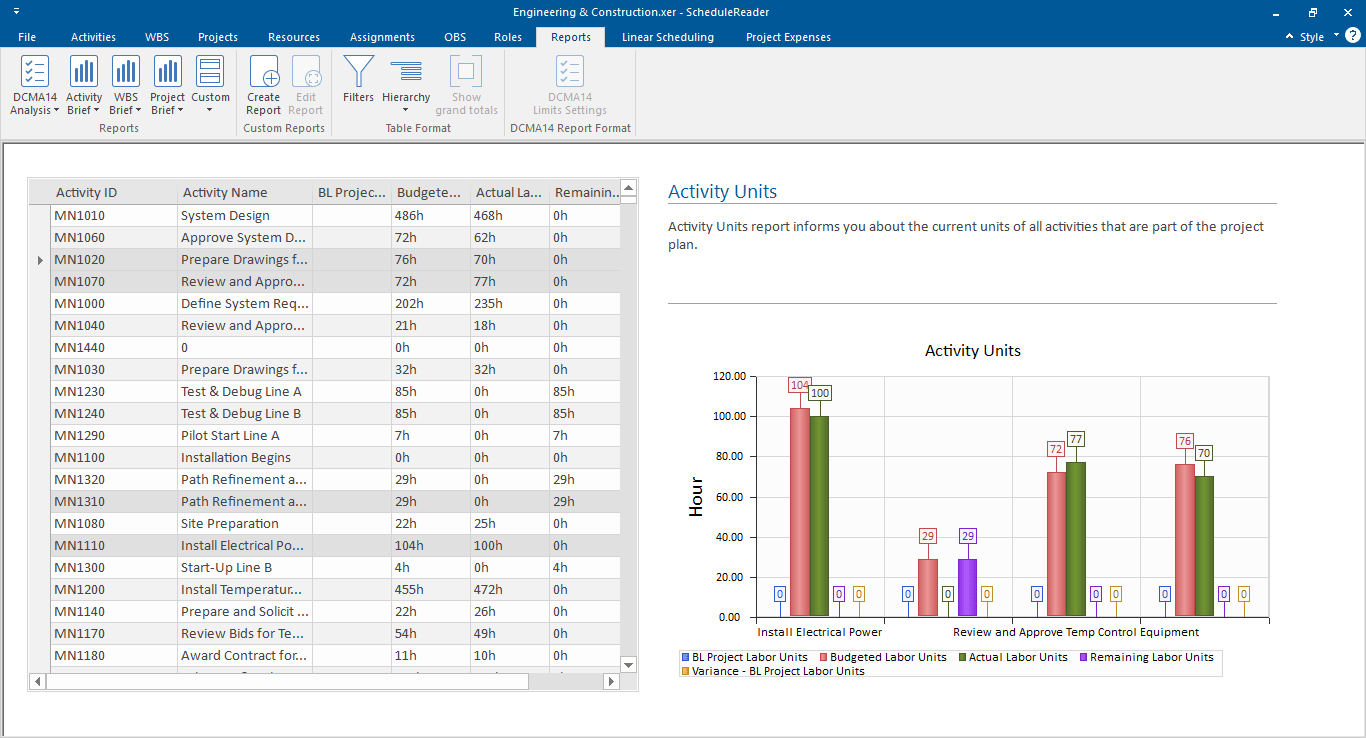
- Activity Units;
WBS Overview;
- WBS Costs;
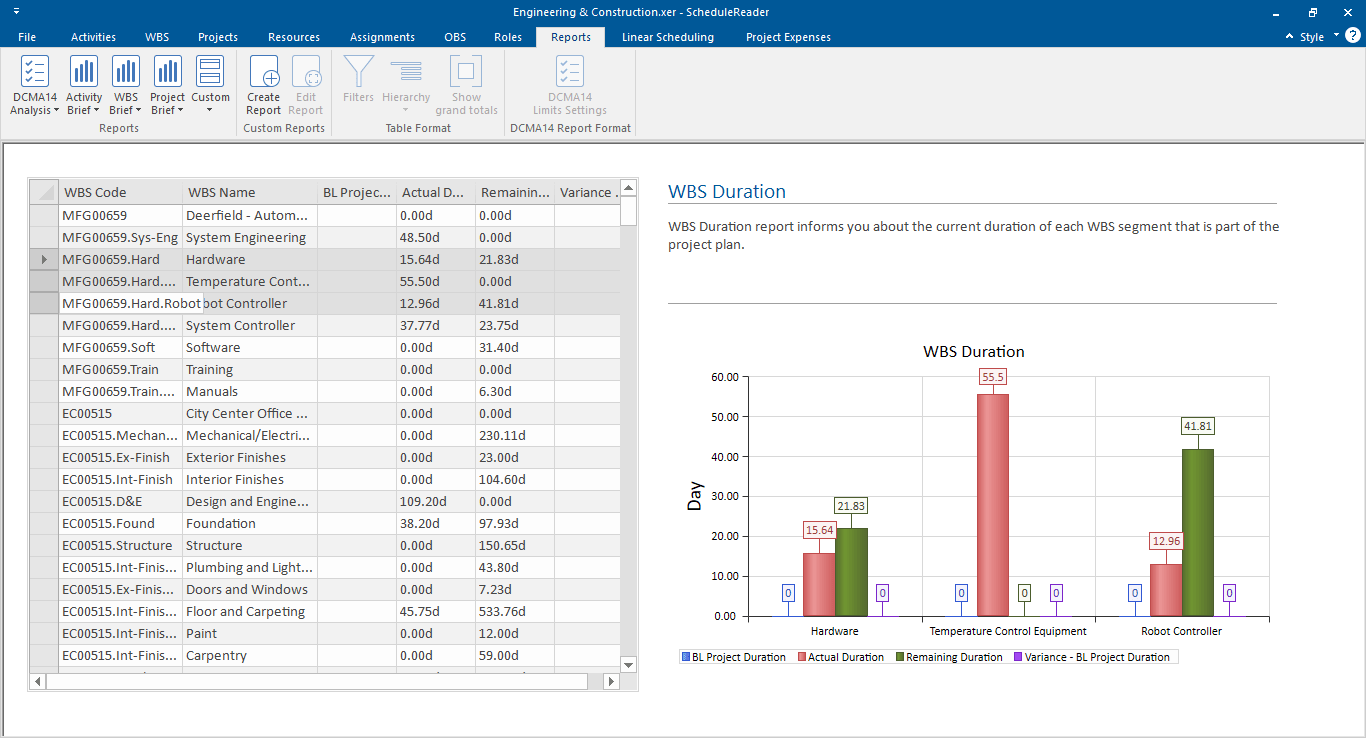
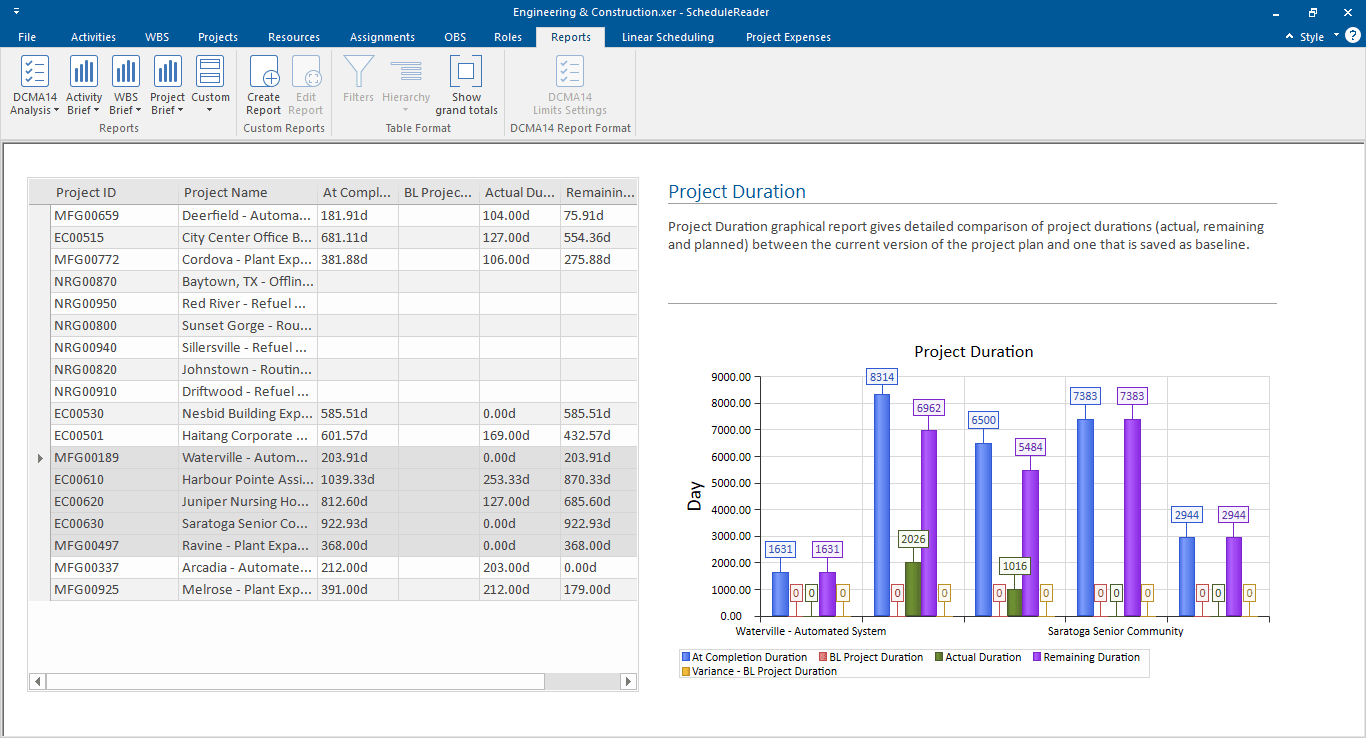
- WBS Duration;
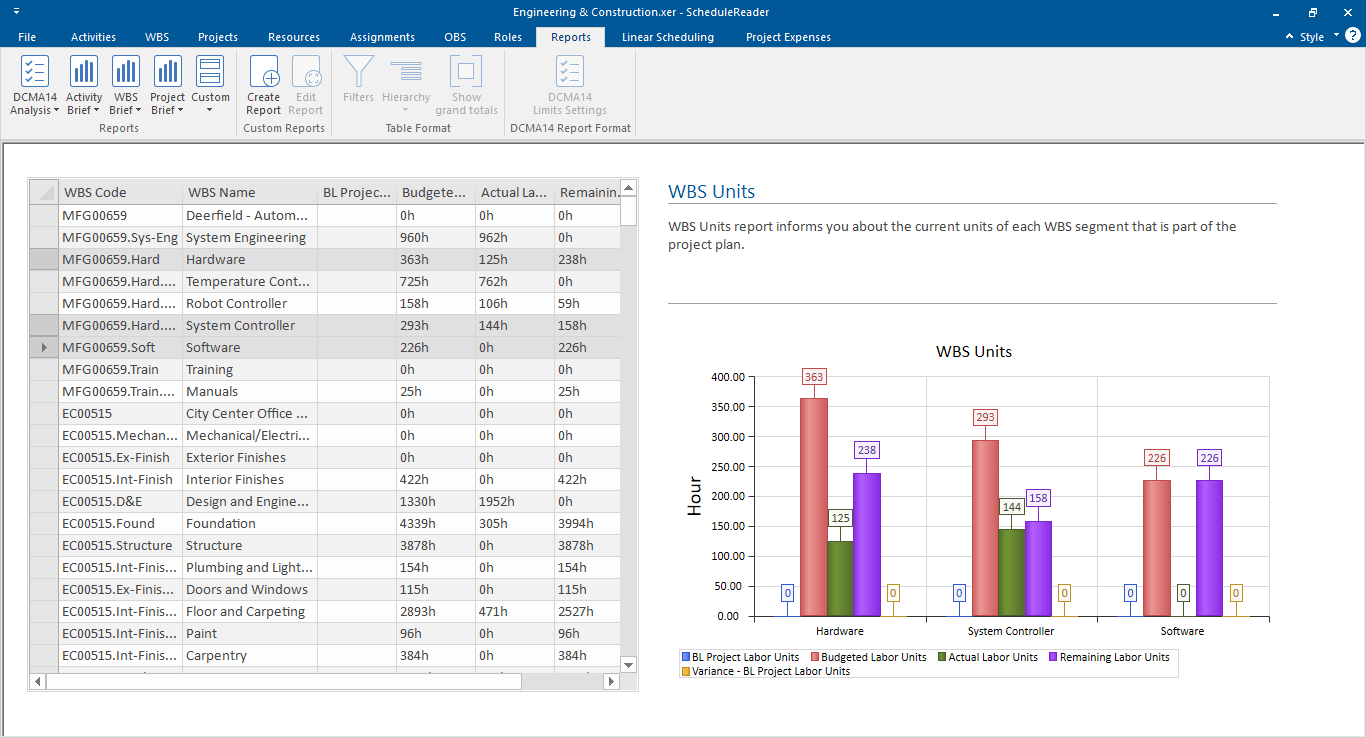
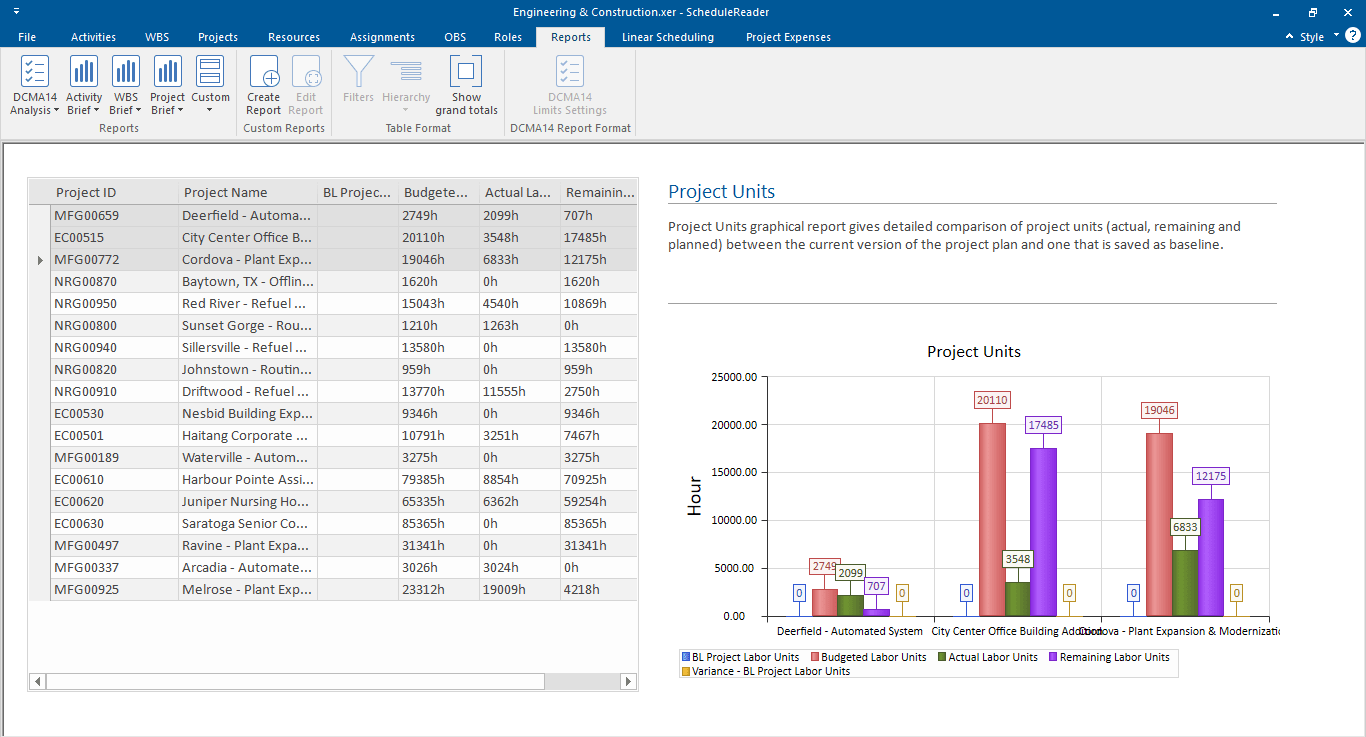
- WBS Units;
Project Overview;
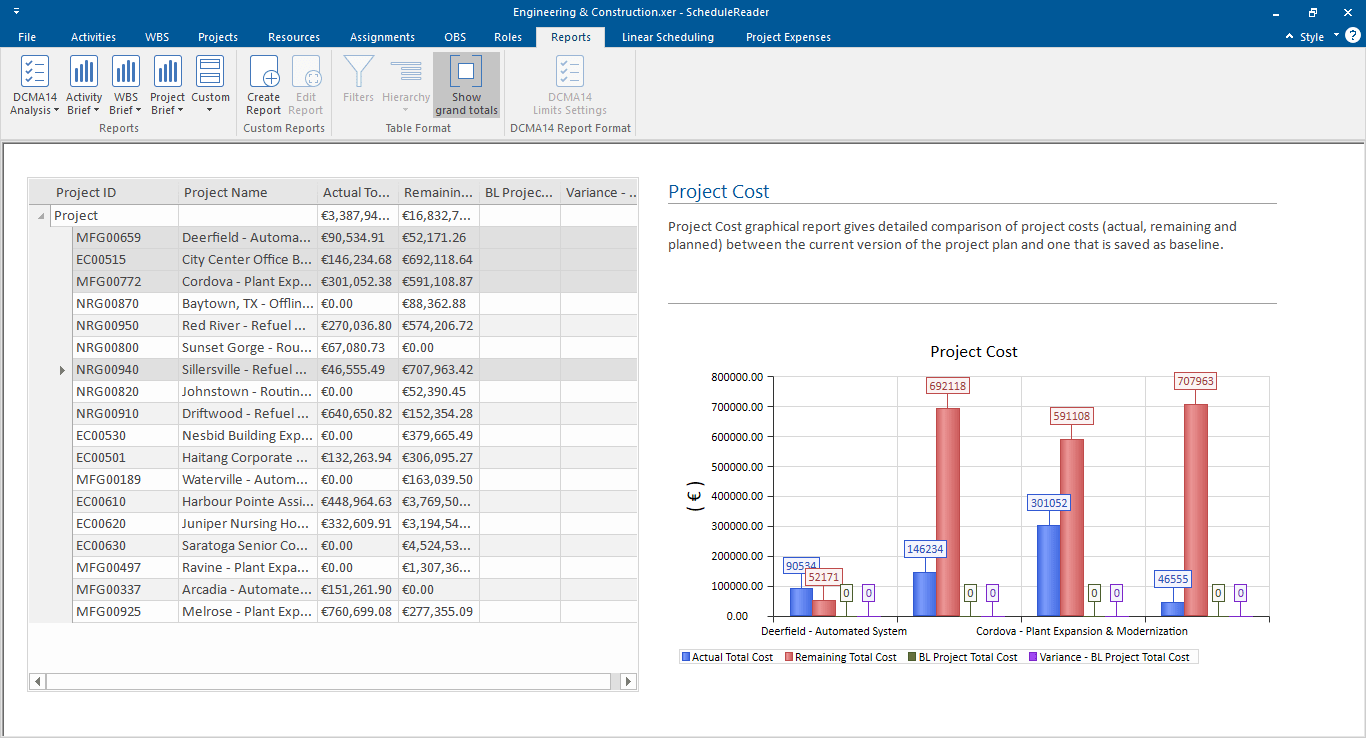
- Project Costs;
- Project Duration;
- Project Units.
Custom Graphical Reports
If the predefined graphical reports does not satisfy your needs, you can create your own, custom reports that will fulfill your requirements.
The creation of a customized report in ScheduleReader™ is done in several steps:
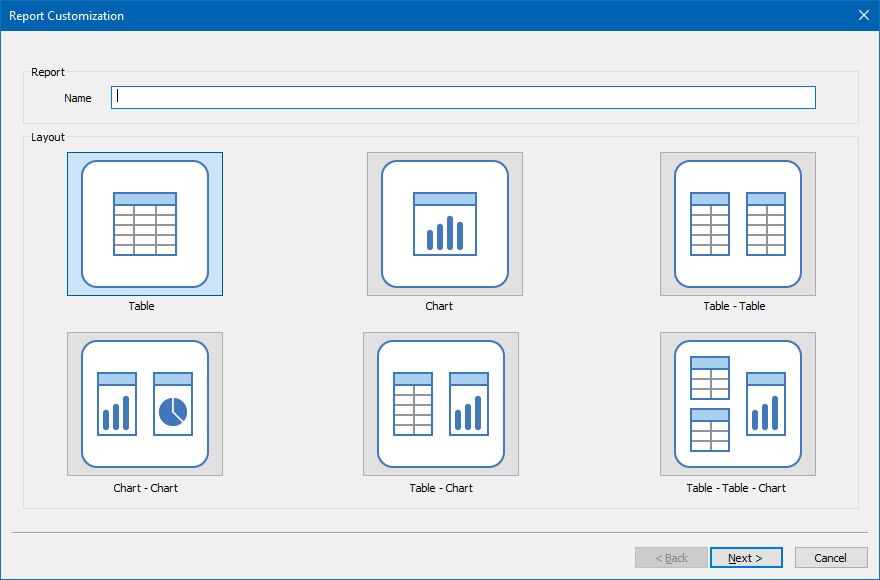
- Click on the Create Report feature, within Reports ribbon;
- Name the new report;
- Select the layout that is most appropriate for you;
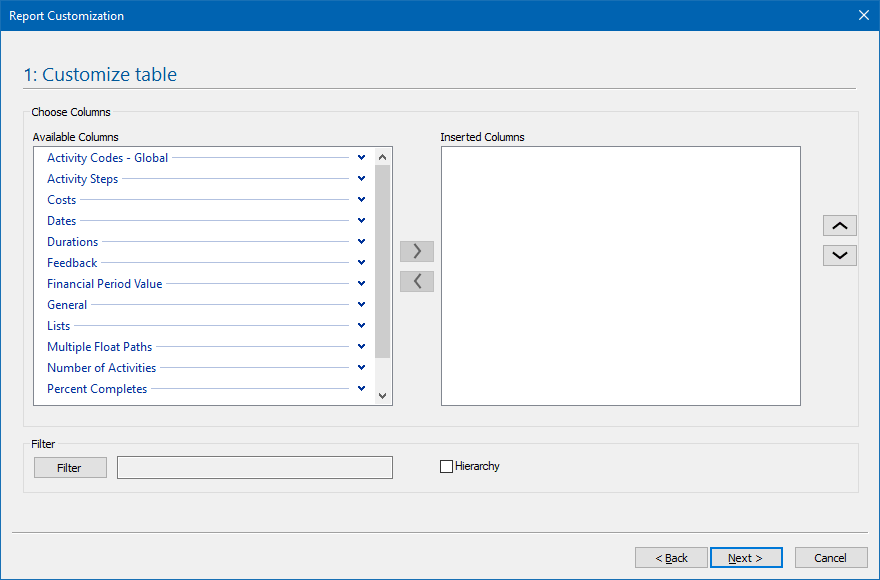
- Customize the table(s)/charts
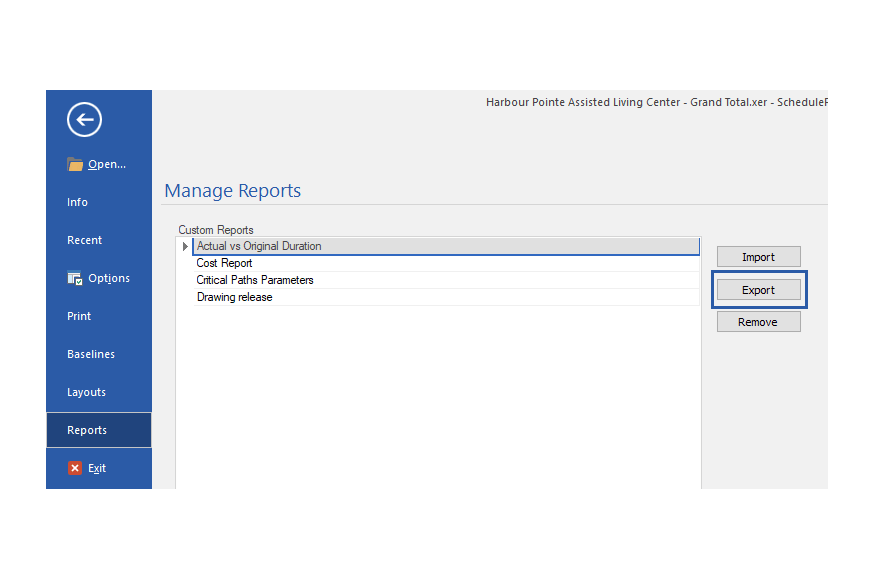
If the user-defined report meets the particular aspects of the project plan and gives the required information, the user can export the report’s parameters into a file and share it with the other team members.
Improve Stakeholder Communication with Graphical Project Reports

Compare and Analyze Project Data
Compare two or more different project parameters from same category, present the changes of a parameter through time or analyze schedule quality with the 14 DCMA checkpoints.

Save Time
All graphical reports are created with a click of a button and can be exported to other project stakeholders. All information is clearly presented and understandable for every project participant.
Keep Stakeholders Informed
Export and share project reports to your team or outside stakeholders, as well as import and review theirs. Customizing reports can be done quickly and easily, by anyone with small effort.
Ready to get started?
Download ScheduleReader™ and try out the new dynamic graphical reports and dashboards!

