Help Articles Baselines How to compare several updated versions of a project file
How to compare several updated versions of a project file?
By using the Baseline functionality you can compare up to four updated versions of a project file in ScheduleReader™.
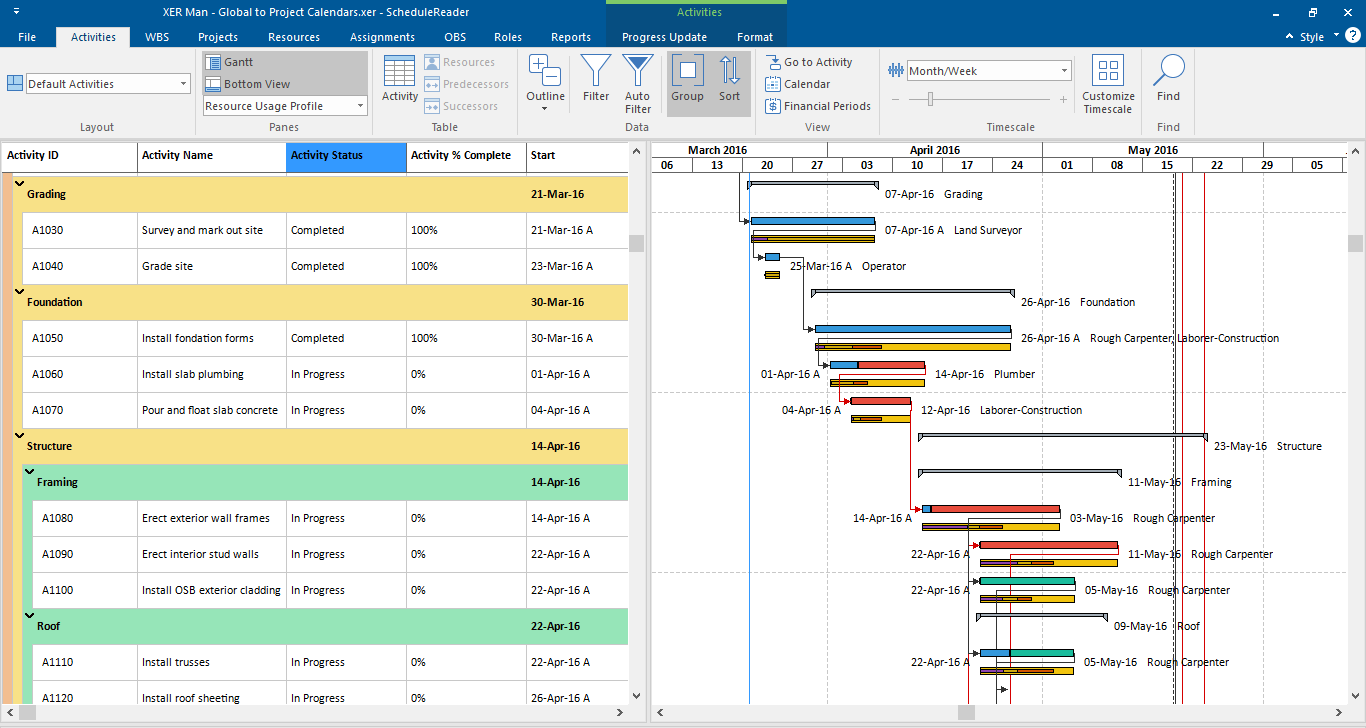
After importing your Baselines into ScheduleReader™, in the Gantt chart, you can see the graphical presentation of the Baselines bars given right below the original activity bar so you can easily compare the schedule changes that have been made.
Note: When you compare projects use the same project with the same activities IDs. The baseline values in ScheduleReader™ are displayed as exported in the XER files.
When calculating earned value from a Baseline “At competition values with current date” option is used.
In the Gantt chart, you can see the graphical presentation of the Baselines bars given right below the original activity bar so you can easily compare the schedule changes that have been made.

Legend of bars displayed in Gantt chart:
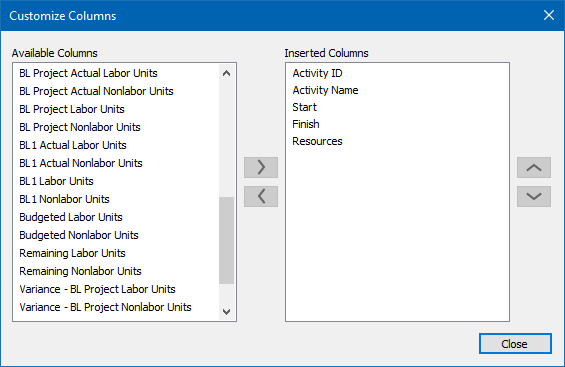
To get the exact values of Baselines, in the Activity table you should add the corresponding Baselines columns:

Note: If the baseline columns are empty, this means that that there is no change made on these activities from the original project. If in the Baseline project there are more activities than in the main project, these activities will not be shown in the Gantt chart, science there is no activity in the main project to compare with.
After importing your Baselines into ScheduleReader™, in the Gantt chart, you can see the graphical presentation of the Baselines bars given right below the original activity bar so you can easily compare the schedule changes that have been made.
Note: When you compare projects use the same project with the same activities IDs. The baseline values in ScheduleReader™ are displayed as exported in the XER files.
When calculating earned value from a Baseline “At competition values with current date” option is used.
In the Gantt chart, you can see the graphical presentation of the Baselines bars given right below the original activity bar so you can easily compare the schedule changes that have been made.

Legend of bars displayed in Gantt chart:
- The light yellow bar shows the Project baseline
- The orange bar shows the Primary baseline
- The dark yellow bar shows the Secondary baseline
- The purple bar shows the Tertiary baseline
To get the exact values of Baselines, in the Activity table you should add the corresponding Baselines columns:

Note: If the baseline columns are empty, this means that that there is no change made on these activities from the original project. If in the Baseline project there are more activities than in the main project, these activities will not be shown in the Gantt chart, science there is no activity in the main project to compare with.
Still have questions?
Our friendly support team is ready to answer your questions and solve your problems via email, phone or demo session.
