Predefined graphical reports give a brief overview of the different aspects of the project plan and sometimes they do not satisfy users’ needs. In that case, the user can create their own, custom reports that will fulfill its requirements.
Creation of customized report in ScheduleReader can be done in several steps:
- Click on the Create Report feature, within the Reports ribbon;
- Name the new report;
- Select the layout that is most appropriate for you;
- Customize the table(s)/charts
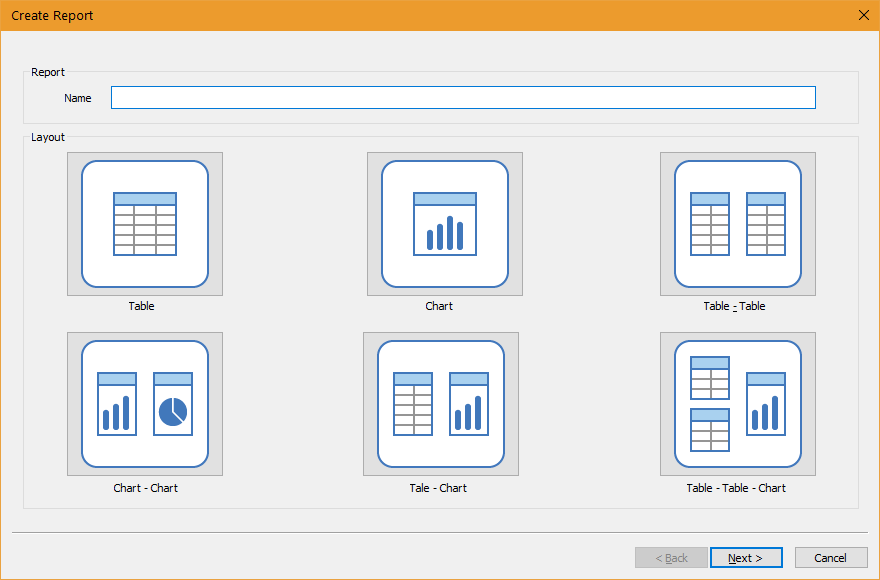
Table layout
Table layout will create a report that is consists of only one table. The user should perform the following steps:
- Choose the columns from the “Available Columns” table the will be presented in the report;
- With
 Down button and
  Up button to arrange the order of the columns in the table;
 - If necessary, apply some of the available filters;
- Select the “Hierarchy” check-box if you like to see the project hierarchy in the table.
- Click on the Finish layout.
Chart Layout
Chart layout will create a report that is consists of only one chart. The user should perform the following steps:
- Choose the columns from the “Available Columns” table the will be presented in the report;
- With and buttons arrange the order of the columns in the table;
- If necessary, apply some of the available filters;
- From the “Chart category” drop-down list select the chart type that will present graphically the values of the selected columns.
- Click on the Finish layout.
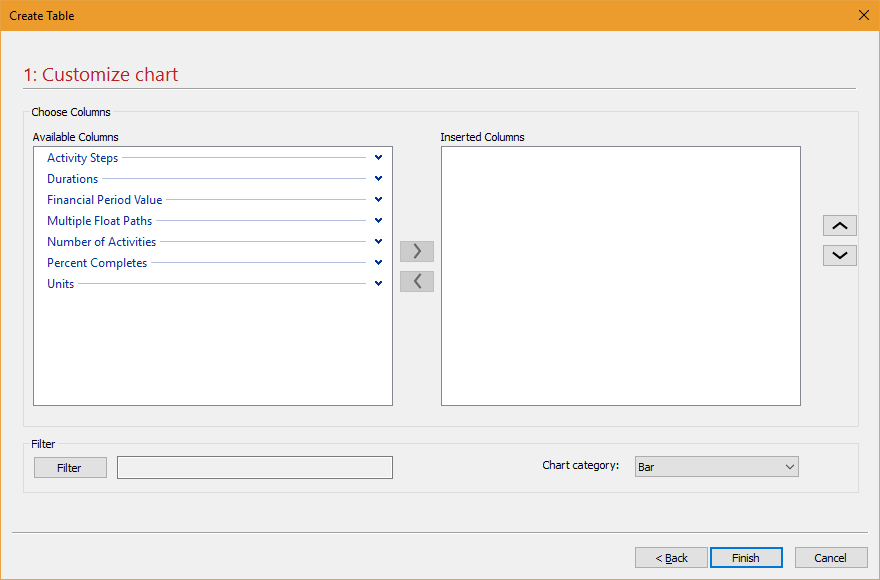
Table-Table layout
The table-Table layout will create reports that contain two tables. Users must customize both tables in two different dialogs in order for the report to be created successfully. The user should perform the following steps:
- Choose the columns from the “Available Columns” table the will be presented in the report;
- With and buttons arrange the order of the columns for the First table;
- If necessary, apply some of the available filters;
- Select the “Hierarchy” check-box if you like to see the project hierarchy in the First table.
- Click on the Next button;
- Repeat the steps from 1 to 4 for the Second table;
- Click on the Finish layout.
Chart-Chart layout
Chart-Chart layout will create reports that contain two graphical charts. Users must customize both charts in two different dialogs in order for the report to be created successfully. The user should perform the following steps:
- Choose the columns from the “Available Columns” table the will be presented in the report;
- With and buttons arrange the order of the columns in the table for the First chart;
- If necessary, apply some of the available filters;
- From the “Chart category” drop-down list select the chart type that will present graphically the values of the selected columns;
- Click on the Next button;
- Repeat the steps from 1 to 4 for the Second chart;
- Click on the Finish layout.
Table-Chart layout
The Table-Chart layout will create a report that will contain a table and graphical chart. Two-step customization (table and chart) must be done in order the graphical report to be successfully created. This layout will be the most used one while creating reports in ScheduleReader.
User should perform the following steps for creating a table-chart report:
- Choose the columns from the “Available Columns” table the will be presented in the report;
- With and buttons arrange the order of the columns for the in the table;
- If necessary, apply some of the available filters;
- Select the “Hierarchy” check-box if you like to see the project hierarchy in the table.
- Click on the Next button;
- Choose the columns from the “Available Columns” table the will be presented in the report;
- With and buttons arrange the order of the columns in the table for the chart;
- If necessary, apply some of the available filters;
- From the “Chart category” drop-down list select the chart type that will present graphically the values of the selected columns;
- Click on the Finish button;
Table-Table-Chart layout
The last layout, but not least is the table-table-chart type of layout. It contains three main elements: two tables and one chart. It is a very useful chart because each of these elements can contain different information from the project plan. A very useful chart for presenting project plan parameters in one chart.
User should perform the following steps for creating a table-chart report:
- Choose the columns from the “Available Columns” table the will be presented in the report;
- With and buttons arrange the order of the columns for the first table;
- If necessary, apply some of the available filters;
- Select the “Hierarchy” check-box if you like to see the project hierarchy in the first table.
- Click on the Next button;
- Choose the columns from the “Available Columns” table the will be presented in the report;
- With and buttons arrange the order of the columns for the in the second table;
- If necessary, apply some of the available filters;
- Select the “Hierarchy” check-box if you like to see the project hierarchy in the second table.
- Choose the columns from the “Available Columns” table the will be presented in the report;
- With and buttons arrange the order of the columns in the table for the chart;
- If necessary, apply some of the available filters;
- From the “Chart category” drop-down list select the chart type that will present graphically the values of the selected columns;
- Click on the Finish button.