Linear project plans from Civil Engineering and Construction (Traffic engineering, Highway engineering, Railway systems engineering, Tunnel Engineering) and Power engineering and construction (Power line engineering) can be created and managed in Primavera® P6®.
In order to view the project plans in the Time-Location diagram, the project scheduler must create three user-defined fields (UDF):
- Two fields (data type: Number) for starting and ending point of the activity;
- One field (data type: Text) for activity shape.
Create User-Defined field
Creating User-Defined Fields (UDF) is performed in Primavera® P6®. The process consists of the following steps:
1. Click on the “Enterprise” menu and select the “User Defined Fields…”.
2. In the “User Defined Fields” dialog select the “Activity” option in the drop-down list and click on the “Add” button.
3. Create the first user-defined field that will represent the starting point for the activity by clicking on the “Add” button.
4. In the title field enter “LINEAR_START_POSITION”. Select “Number” for Data Type.
![]()
5. Create the second user-defined field that will represent the ending point for the activity by clicking on the “Add” button.
6. In the title field enter “LINEAR_END_POSITION”. Select “Number” for Data Type.
![]()
7. Create one user-defined field with the title “LINEAR_SHAPE_CODE” and select “Text” for Data type.
![]()
8. After creating the mentioned fields, the “User Defined Fields” dialog will look like the image below.
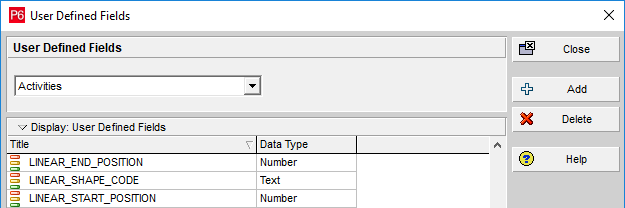
Important Note: UDFs names must be inserted as in the example: “LINEAR_START_POSITION”, “LINEAR_END_POSITION” and “LINEAR_SHAPE_CODE”. Otherwise, the application will inform you that the required fields for drawing time-location diagrams are missing from the project.
9. Close the dialog.
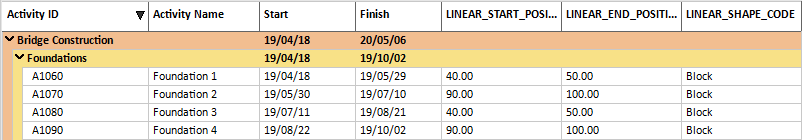
Once the UDFs are created, insert them in the Activity table and populate the values for Start Point”, “End Point” and “Shape”. Example for populating these fields is presented on the image below:
Apply Time-Location chart
When the project file is loaded, ScheduleReader™ checks whether the mentioned user defined fields (LINEAR_START_POSITION, LINEAR_END_POSITION, and LINEAR_SHAPE_CODE) exists in the .xer file. If these fields are not part of the project plan, the ScheduleReader™ will pop up a message when the time-location diagram is selected.
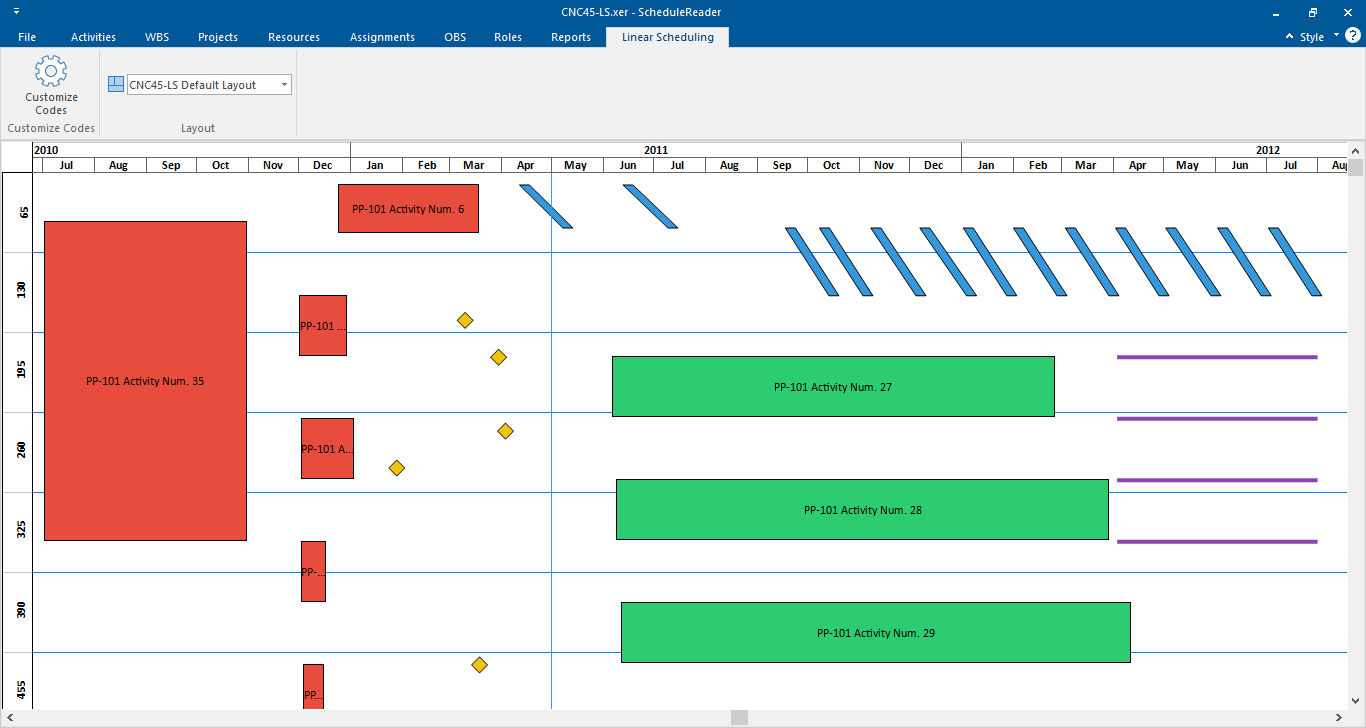
The initial look of the time-location diagram for any project is presented in the image below.
Chart customization can be done using the “Customize Codes” option. Using this dialog, users can choose whether the come bar will be presented or not, choose the graphical type that will be associated with the specific code and the object’s colors as well.
Chart’s customization is performed with the following steps:
1. Using the check-boxed in the “Display” column, the user decides whether that particular shape will be presented in the view or not;
2. Each field from the “Code Type” column contains drop-down list with the available shapes. By default, all codes have “Line” type, but the user can change it.
3. Changing the color of specific code is done by using the features in the “Code Style” section. User can change the “Main Color” and the “Border Color”.
4. Assigning start and finish shapes can be done by using the eponymous functionalities from the “Code Style” section.
After customization, the view will be changed according to the standards, rules, and recommendations that are used in each company when linear projects are managed.
Depending on the project data, the project plan in ScheduleReader™, will look similar to the image below.