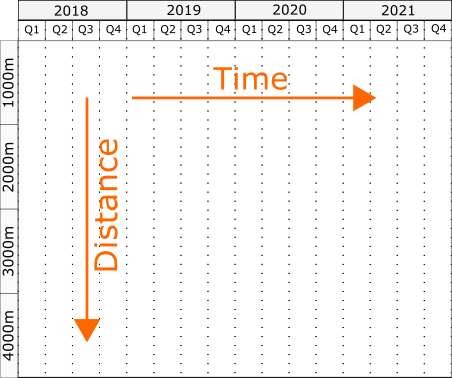
Introduction to Time-Location Diagram
Time-Location view (other names: Time-Location chart, Time-Distance chart, etc.) is a view that is used in projects that have repetitive activities. Repetitive activities are commonly found in projects for gas and oil pipelines, rails, bridges, tunnels, roads, high-rise buildings, transmission lines construction, etc. In the industry, these projects are known as linear projects.
Time-Location chart will help project managers and team leaders to view the time and location at which a certain project team will be working on a specified project assignment.
Main Elements
The time-Location chart consists of two axes: one for the distance (location) and the other for a time. In ScheduleReader™, the time axis is presented in a month, while for the distance axis the units depend from the metric that is inserted in the user-defined field.

Each activity in the Time-Location chart is presented with a specific bar. The following bar shapes are available in ScheduleReader™:
- Line–line shape in time-location chart is used to represent simple activity that is undertaken by a particular project team, such as pulling telecommunication or transmission line cable, asphalting specific section of the highway, etc. The project team starts working on the given start location, on the specified start date, and work until reaching the finish location on the planned finish date;
- Bar – similar to the line shape. The difference is in the time needed to complete the assignment;
- Block – when project activity lasts a significant time, it is represented in the chart with block shape. In this case, the one side length of the rectangle corresponds with the time needed for completing the activity, while the length of the other side corresponds with the amount of assigned work.
- Diamond – as in the traditional presentation of the project plan, the diamond bar shape represents a milestone, a specific point on the project timeline.
Which bar will be assigned to each project activity, depends on the user’s decision.
