

Upcoming Webinar: Overview of ScheduleReader and ScheduleCleaner | 27 June, 10 - 11 AM GMT
Upcoming Webinar: Overview of ScheduleReader and ScheduleCleaner | 27 June, 10 - 11 AM GMT
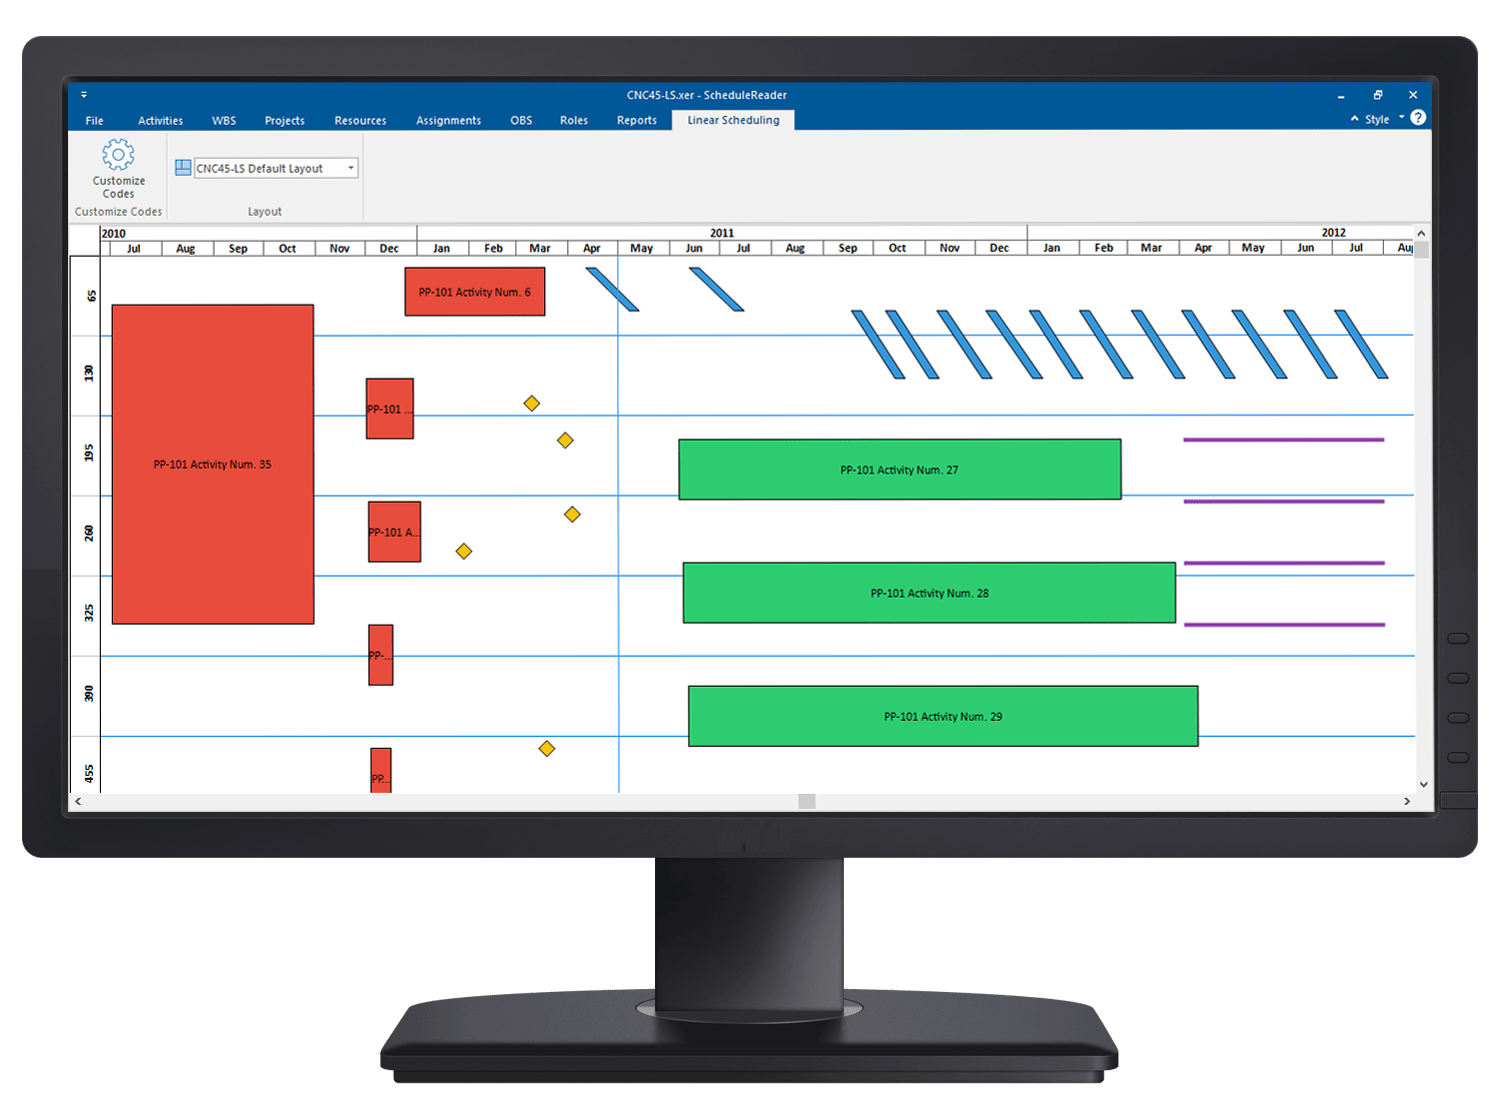
ScheduleReader is a software used to view linear projects from existing XER and XML schedules through Time-Location charts and diagrams.
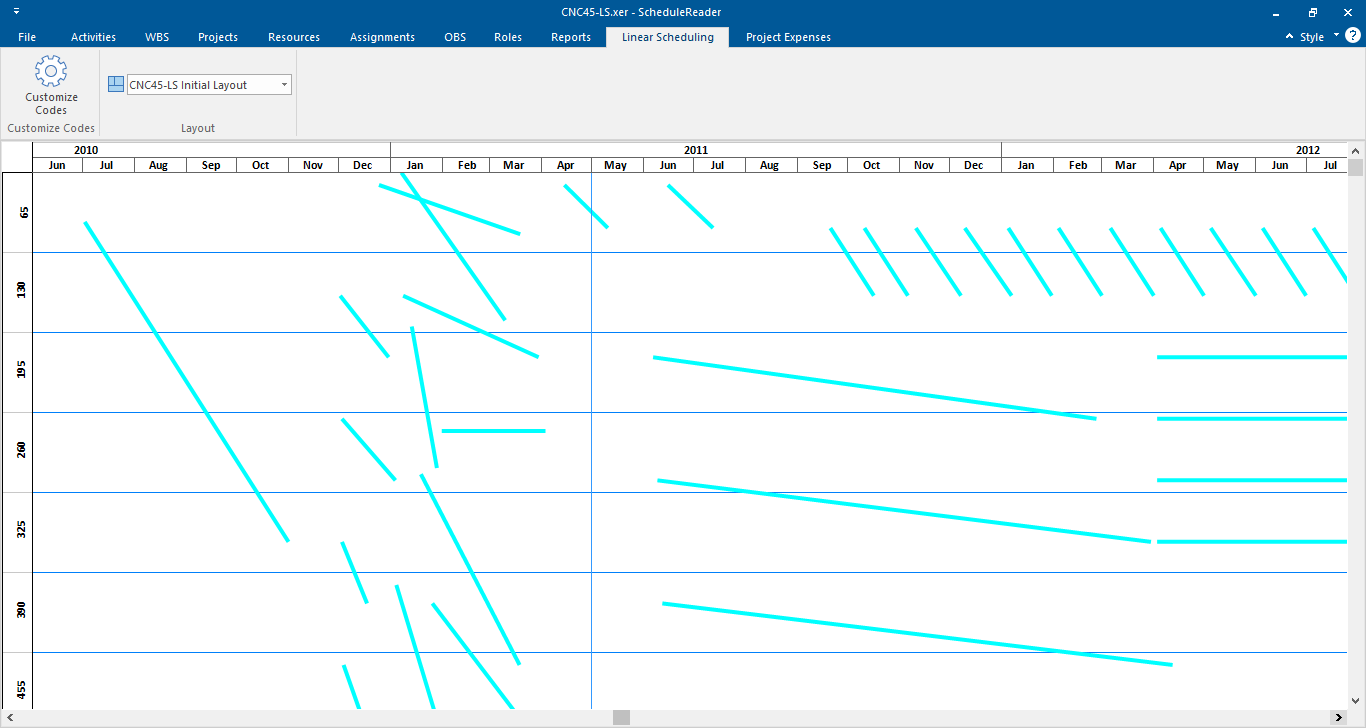
ScheduleReader’s Linear Scheduling View displays a complete overview of linear scheduled projects from .xer and .xml project files created with a linear scheduling software such as Oracle® Primavera P6.
The new Linear Scheduling View was implemented in the recent version release 7.0 of the ScheduleReader software.
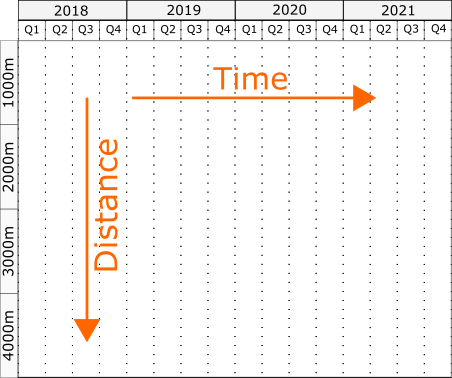
The time-location / chainage chart or diagram presents a graphical representation of a schedule alongside time and distance axis.
These charts are specific for projects with repetitive activities, referred to as linear projects in the construction industry. They are commonly used in the Civil Engineering, Construction & Engineering, and Power Engineering industries. Project examples include:
The time-chainage diagram or chart is also known and commonly referred to as:
View your liner projects schedules created using the linear scheduling method through time location charts in a single page graphical overview.
Eliminate the need to learn and use different linear scheduling software. ScheduleReader visualizes all project data inside XER and XML schedules.
Allow your entire team a clear view and insights of the current project status through visually understandable Time chainage charts and diagrams.
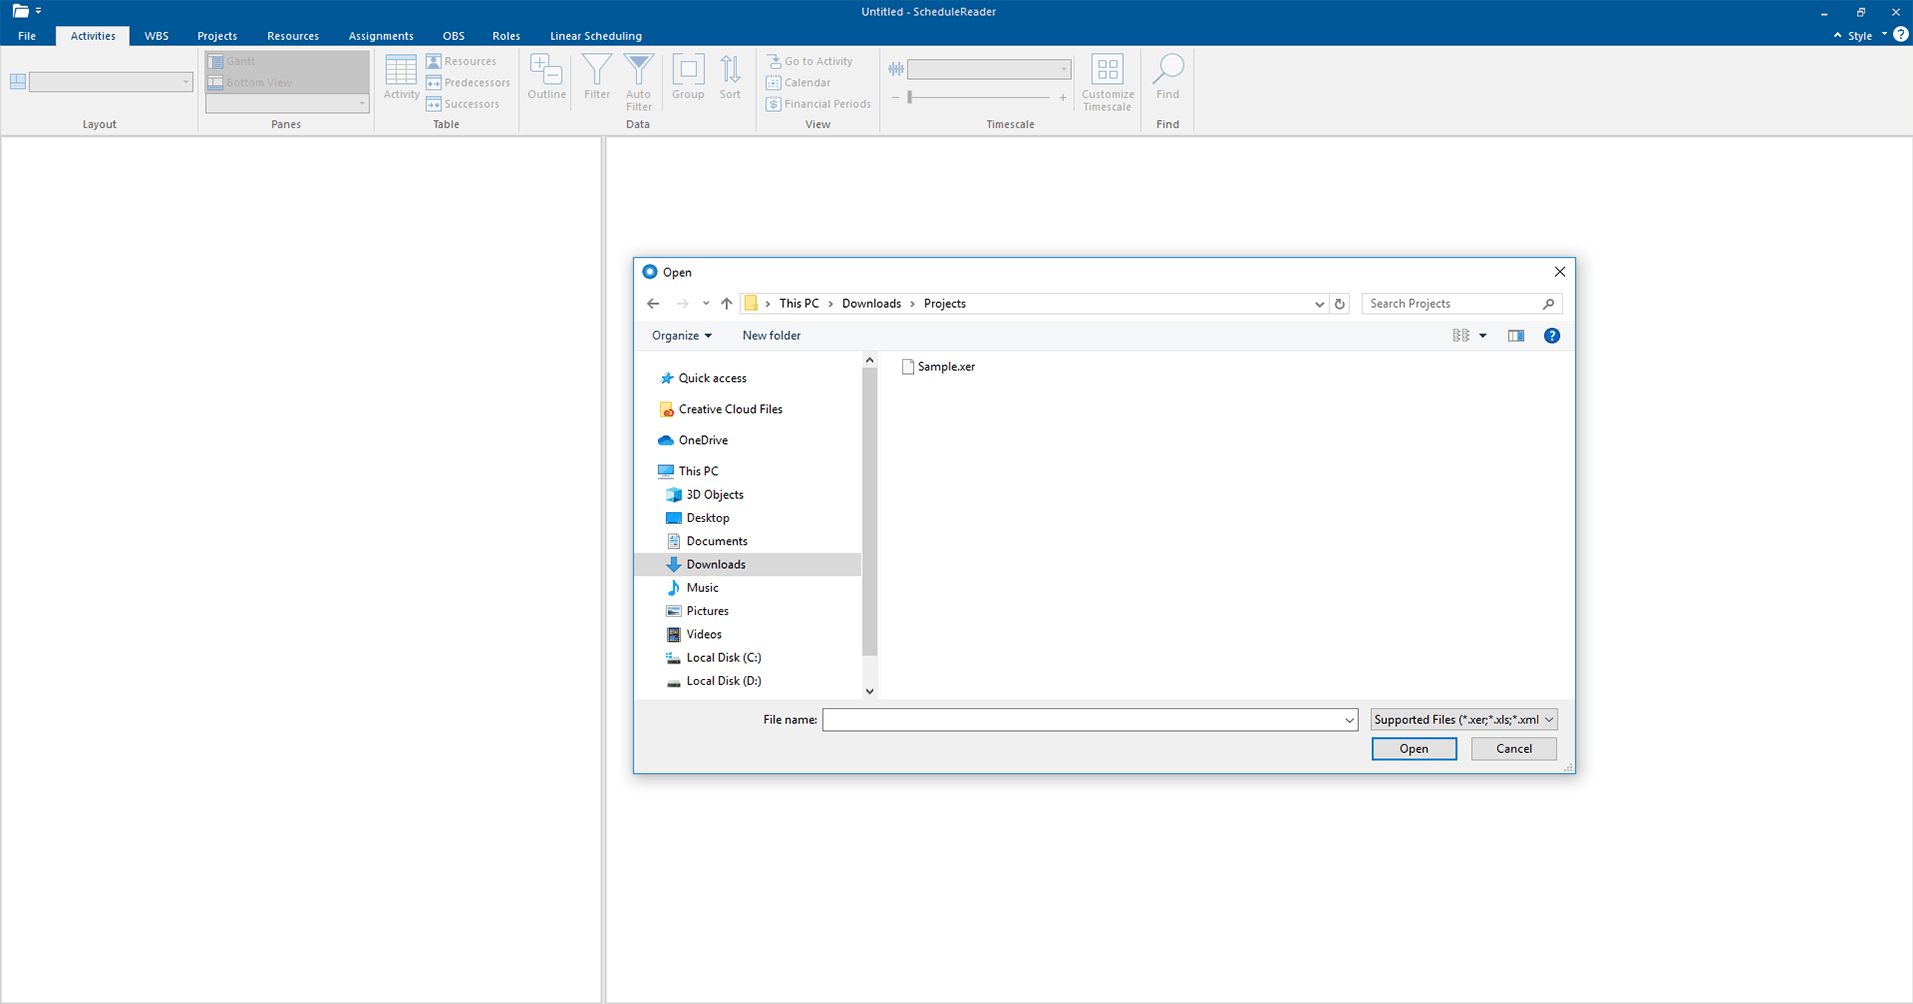
Viewing Linear Projects is made simple with ScheduleReader! Follow these two steps and view your linear project in a Time-location diagram.
Open ScheduleReaderTM and import your XER / XML project schedule file, with the linear planned project.
Navigate to the Lienar Scheduling View and view your project in a Time-location diagram / Time Chainage Chart.
Note: In order to view the project plans in a Time-Location diagram, the project file should contain three essential user-defined fields (UDF), which the project scheduler must specify upon the creation of the project plan using the linear scheduling software. The following parameters need to be assigned: Start and End point of the Activities and Activity shape.
To read a textual explanation on how to create the required UDFs visit our help articles available through the website and inside the ScheduleReader application.
Download a fully featured version of ScheduleReader™ and try out the new Linear Scheduling View!