Understand, Plan and Control with PERT and CPM – The Differences Between PERT vs CPM
It is important for the project manager to use diligence in schedule development that puts the team in a position to provide effective control. A significant source of project failure, from experience, is related to the schedule. There are techniques we can employ to reduce the schedule risk, specifically, PERT and CPM.
The project manager is expected to work with the team to manage the project. One cannot manage what one does not understand. This applies to the project strategy, the project scope, and the project schedule.
Project manager work with the team to plan out the effort. Planning can go through multiple iterations as we work out the best approach, this is especially true for the development of the schedule. Task variation, for example, will have an impact on the schedule and perhaps our strategy for the project. We have written on task dependencies in another article so we will not dwell on it here, but the way we structure our approach to the work will have an impact on probability of success.
To be able to control, we need to know where we are, and where we are heading. That is the use of our schedule. The schedule can be viewed as the road map for our effort. We have metrics associated with each deliverable and task. The schedule and associated metrics will be used to compare where we are, with respect to where we should be to meet the objectives of the project.
To successfully understand, plan and control a project, a firm grasp of PERT and CPM, two network-oriented graphic representations of a project’s timeline can be of great benefit.
What is PERT?
PERT stands for Program Evaluation Review Technique and is a network-oriented graphic to represent a project schedule. PERT activities are shown as activity-on-arrow (AOA). PERT is used to identify the estimated time to deliver a task or deliverable.
What is CPM?
CPM stands for Critical Path Method and is a network graphic of sequential activities to determine the minimal time to complete a task or project. CPM activities are shown as activity-on-node (AON). Generally, the estimated times from the PERT are used to create and establish the CPM diagram.
What is the difference between PERT vs CPM?
The key difference between PERT vs CPM is that PERT is used in developing the initial timeline, whereas CPM is generally used as a tool to establish the critical path to the completion or delivery of the project.
Let’s dive into more details.
PERT
PERT Inputs
PERT, Program Evaluation Review Technique provides mechanisms to gain understanding of our proposed approach to understanding the consequences of variation on our tasks. One of the problems that occur as we develop the schedule, is the duration of the tasks that comprise the schedule. To develop the project schedule, takes a series of steps.
Estimating durations can be difficult. It can be like reading the runes. Estimating is the epitome of educated guesses, and projects undertake new things, and as such means we may not have an exact analog to this particular set of circumstances. Our level of education may not be so high.
Estimating
The project schedule consists of tasks. The duration of the tasks, and how the tasks stack up in our project schedule will produce the date of conclusion of the project. From experience, task variation is often not included in the schedule.
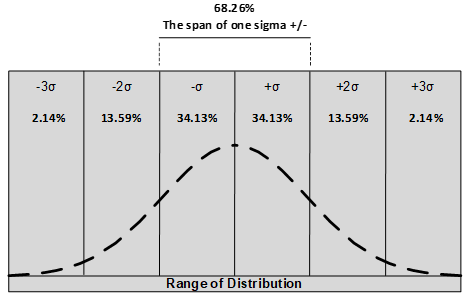
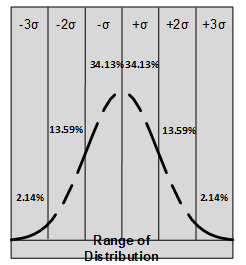
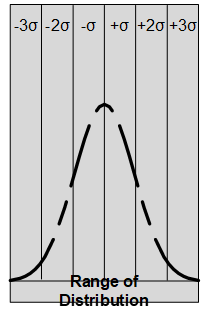
If we have enough historical data for some of our past efforts, we may be able to develop curves that represent the range of possibilities for the task under consideration. Below the graphic demonstrates a normal distribution of a task. Through mathematics, a six-sigma distribution can be predicted. Below find examples of a variety of distributions.


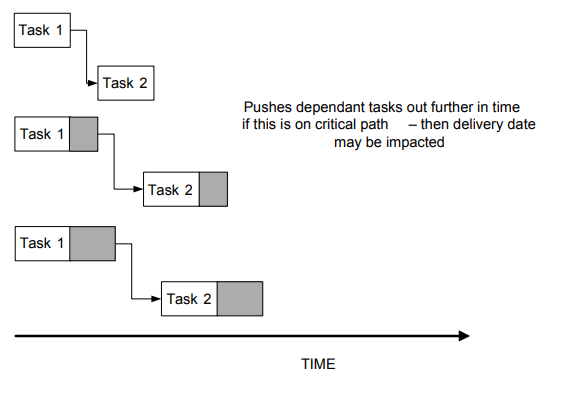
This range of variation will have an impact on the chain of tasks on the schedule. Consider below, the impact of this ask variation on the schedule. Creating a schedule with a task duration as a single point, and especially at the least duration, comes with risk.

Estimating using PERT
PERT attempts to provide fabricate the normal distribution of the possible durations for a specific task. In this case, rather than generate the curve by data, we are using the estimates from the team to determine just how wide the range of variations possible. To do this, rather than use what can be referred to as single point source estimate, we will get a range of estimates from our team according to below:
- P = Pessimistic
- ML = Most Likely
- O = Optimistic
These numbers will then be used for the equation below to determine the average, or center point of the estimates. It is possible to build out the six-sigma variation of the estimates if one were so inclined, but we will not go into that detail here. If there is interest in this additional exploration note so in the comments section and we will write on this topic.

This is not a golden solution, or a panacea for our estimating problems. The equation and the additional six-sigma calculations, assumes the distribution of the task under study is normal. The chances of this task being normally distributed is not very likely. It is more left skewed.
Critical Path
Words have specific meaning, and the more technical the concept the more specific the meaning. We have experienced the abuse of this term over the years. Before we move on the critical path method (CPM) we should first review the critical path.
“Sequence of activities that represents the longest path through a project, which determines the shortest possible duration.” – source: Project Management Book of Knowledge (PMBOK) 5.0

The graphic above is a network diagram for a project. There are three legs itemized below. The longest path for this project is 20 days. Any task that goes longer than planned, will push the date of closure of the project. The other two paths (leg 1 and leg 3) have float (2 days and 17 days respectively).
| Group | Sequence | Duration |
| Leg 1 | A, B, D, close | 18 days |
| Leg 2 | C, E, F, close | 20 days |
| Leg 3 | G | 3 days |
Critical Path Method
The critical path method uses network diagrams as illustrated above. It provides a graphical illustration of how the various tasks fit and create the entire schedule. Most tools such as ScheduleReader and Primavera P6 will highlight the critical path of tasks in red. The following article illustrates how to visualize the critical path in XER schedules using ScheduleReader.
CPM Inputs
- Work Breakdown Structure
- Sequence of Activities / Tasks
- Duration estimations for those elements
- Create a Network diagram
Applying CPM to a project schedule, results in a Critical Path Schedule (CPS). The CPS helps identify:
- Activities that must be completed on time to deliver the complete project on schedule.
- Tasks that can be delayed without impact to the project schedule
- How long it will take to complete the project
- Float/Slack of each activity to maintain the project schedule
- To know which task must be monitored to maintain the project schedule
More on CPM and its use in construction project scheduling and Primavera P6.
PERT VS CPM – Learn what is CRITICAL to achieving schedule objectives
Critical path method makes it possible for the project manager to either calculate the critical path, or to have their preferred tool for the project schedule to create from the Gantt chart. To keep the project on time, spending time worrying about the other paths, is less productive than a focus on the schedule with the least amount of slack, which is leg 2 from above. Any extending of leg 2 will be delay the project conclusion. The other two paths have some float, which is time available to extend without impacting the end of the project.
PERT vs CPM – What are the differences?
The goal of both approaches is to understand the tasks and how the tasks fit together to create the schedule. Understanding the tasks, and the critical path are steps required to shorten the project duration while still achieving the results.
Creating a reasonably defendable project schedule takes more than slap dashing tasks together to create a schedule. That is not to suggest the contrary that we should spend an indeterminate amount of time understanding the tasks. The string of tasks of most importance is that of the critical path. Some review of the task variation (PERT). Knowing the variation of tasks will provide us with a range of possible dates for the project conclusion.
- PERT is not a mathematic indicator of the range of possibilities, but an attempt to provide the project manager with the possible task duration variation.
- The wider the estimated interval between Pessimistic and Optimistic, the more uncertainty in the estimates.
- The dependencies of the network diagram (how we schedule the work items) will impact the critical path, meaning take care in schedule development. Try several task sequencing and dependencies.
- Applying PERT on specific paths of the project network diagram (the critical path) can provide the project manager with a range of dates the project will likely conclude.
- PERT is more closely associated with building the schedule
- Monitor the critical path during execution of the project, it is possible for delays on other network legs to cause the emergence of a new critical path.
Similar articles: Linear Method of Scheduling vs CPM.
Authors

Jon M. Quigley PMP CTFL is a principal and founding member of Value Transformation, a product development training (from idea to product retirement) and cost improvement organization established in 2009.
Steve Lauck is a retired Management Consultant who helped businesses solve project management problems ultimately improving project delivery.

