
Understanding Primavera P6 Histograms
Introduction to Histograms
Histograms are bar charts depicting distinct, numerical, and statistical data with the goal being to relate an analytical examination of patterns, frequencies, and intervals. Due to their analytical and statistical nature, histograms are popular in project management. Histograms allow the project team to view the patterns of data in a picturesque form, making it easier to comprehend vast amounts of numerical data with a visual appeal.
A stacked histogram dissects the project data by presenting different colors and/or patterns of bars on top of each other. The data identifies the patterns and quantities of something specific. Histograms can be used in a variety of industries and can relay valuable information based on an array of variables as long as they are numerical. In project management, stacked histograms and manpower histograms shine because they can reveal resource allocation over the project lifecycle, and this data can be divided into specific periods.
Histograms in Primavera P6
Primavera P6 offers the graphic capability of histogram generation, and the depictions are impressive. Primavera P6, like any project management tool, requires solid data to properly relay in graphical analysis to the project team. One of the most common types of histograms desired by project management from Primavera P6 is the resource histogram. This article will address the method to generating and reporting on a Primavera P6 stacked histogram and it will demonstrate how to view and customize the histogram in ScheduleReader.
Stop wrestling with Primavera XER schedules.
Your team can see your schedule without buying a P6 license.
Start Free Trial No credit card · Windows & Mac · From $344/yr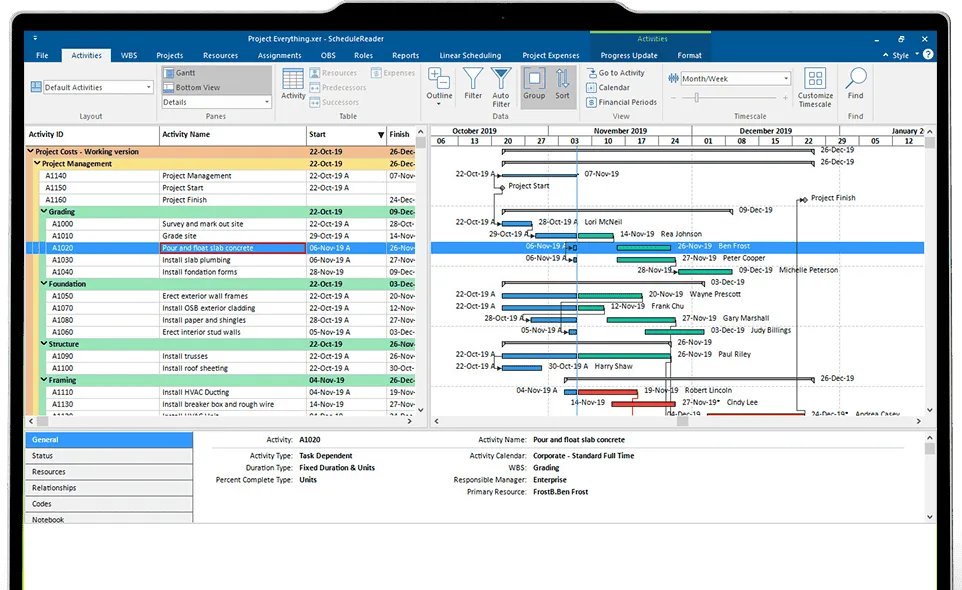
Please take note that the prerequisites of generating a Primavera P6 histogram (including manpower histogram) include the general project management best practices implemented in the project schedule before starting the process. Such requirements include the following factors: a fully resource-loaded project schedule (labor or material or both), a solid baseline, logic, and a data date with any progress to date put into the schedule.
Creating and Customizing Histograms in Primavera P6
Once the project is open, go to the Resource Usage Profile icon in Primavera’s top layout bar menu or go to the View tab and select “Show on Bottom” and then “Resource Usage Profile”:


Go to the bottom half of the Primavera P6 screen and use the pull-down arrow next to “Display: All Resources” to select “Filter By” and then “Current Project’s Resources”. This will filter out only the resources in your currently open project:

Initially, you can view the histogram by highlighting a single resource in the project:

Select all of the project’s resources by highlighting them on the left side to view the total resources in the histogram on the right side:

Right-click in the histogram area and select “Resource Usage Profile Options…”:

We will use the following options for formatting in this exercise, as depicted in the two option boxes below:


Use the pull-down arrow next to “Display: Open Projects Only” again and select “Stacked Histogram”:

The histogram field will show as blank at first:

Right-click in the blank histogram field and select “Resource Usage Profile Options…” from the pull-down menu:

When the Resource Usage Profile Options box launches, select “Add” from the bottom of the box:

In this example, we are going to use a few of the resources to create our histogram, although you will likely want to set up all resources in your initial view. First, rename the selection in the “Filter Name” to the name of the resource that you are selecting. Set the “Is” field to “equals”. Then, under the Parameter, select “Resource ID” from the menu. For the Value option, we will select “ATM Engineer” from our selection of the current project’s resources and then select “OK”:

You will see the single resource in the histogram:

Select the Resource Usage Profile Options box again to add additional resources to the view. You will do this by repeating the previous steps after selecting the Add button:

You can use Primavera P6’s default colors for each resource, or you can click in the Color box selection of each resource to designate a specific color of your choice from the available selections. Once you are complete, click “OK”:

You now have a stacked histogram that shows the allocation of the resources over the project’s timeline:

You will want to save your new Primavera P6 histogram view for future use. Go to the top menu and use the pull-down arrow under your current layout and select “Layout” and then “Save As…”:

When you are prompted, update the layout name and make the view available to the current user. This way, your histogram view can be used and modified for other Primavera P6 projects:

Primavera P6 allows you to print histograms as well. Use the printer icon in Primavera P6’s top layout menu, use the shortcut key Ctrl-P, or select “Print” from the File tab and select the Print Preview option. You can set up your timescale start and finish dates, and ensure that you only have “Profile” selected in the Print options as depicted in the image below. Use the other tabs to customize your margins and paper size:
![]()
The print preview shows you what your Primavera P6 stacked histogram will look like when you print it:

Creating and Customizing a Project Histogram in ScheduleReader
Several of ScheduleReader’s features are similar and convenient as the ones found in Primavera P6, such as the ability to view and customize histograms from a project schedule that has been imported as a Primavera P6 XER file. After importing the Primavera P6 XER file and its associated baseline, go to the Activities tab, select “Details”, and then choose the option for “Stacked Histogram” from the pull-down menu:

As you previously saw in Primavera P6, at first the histogram screen shows up blank without data:

Next, go to the Format tab and select “Resource Usage Profile Options”. For this exercise, we will use “At Completion Units” with “No cumulative curve”. Then select “Add”:

The Add button will allow you to customize the histogram with the resources that you want to see. Select the resource that you want and rename the “Filter Name” to the identifying title of the resource:

Once you have accomplished the previous step, continue to use the Add button to select additional resources. Similar to Primavera P6, you can use the ScheduleReader default patterns and colors for each resource, or you can click on each selection’s pattern and color options to create a custom view:

Click “OK” to view the result of the stacked histogram in ScheduleReader:

Like so many features in Primavera P6, ScheduleReader offers a similar platform to develop the same reports, including histograms, used to see manpower and resource allocation. To print your stacked histogram, go to the File tab and select “Print” and then “Page Setup” at the lower part of the options screen:

The options resemble the Primavera P6 screen for the Page Setup. Customize your date scale using the preferred project scope start and finish dates, and only choose “Profile” to checkmark. You can use the other tabs in the Page Setup dialog box to create headers, footers, or to customize sizing and margins. Click “OK”:

ScheduleReader provides you with a print preview of the stacked histogram:

Efficiencies in Team Collaboration Using ScheduleReader and Histograms
Understanding manpower, resource allocations, and the distribution of work throughout a project are critical to managing projects and identifying risks to the project timeline. Utilizing ScheduleReader offers the project team similar and convenient features that can be found in Primavera P6 for team collaboration, such as its picturesque ability to display s-curves, histograms, and stacked histograms with the option to customize the individual resources, patterns and colors within the histograms. This feature can be successfully obtained from an imported Primavera P6 XER file, whether the user has access to Primavera P6 and is considered the “power user” or not.
Such functions allow cross-team collaboration while keeping all members of the project team current on the project schedules and risks of resource over-allocation throughout the project’s life cycle. Project team members benefit in large operations where expensive Primavera P6 licenses may not be possible for all users or even necessary. ScheduleReader’s ability to depict visually appealing and data-rich manpower histograms can be invaluable to the project team.

Experienced professional on the executive side of the business with nearly 20 years of knowledge and practice in: Project Management as a Program Cost and Schedule Control Analyst on multi-million/multi-billion dollar projects, Project Controls and Planning, Strategic Planning, Engineering Planning, Earned Value Management (EVM) and Earned Value Management System (EVMS) implementation, Configuration Management.


