The Activity Metrics graphical report gives a detailed comparison between the current version of the project plan and the active baselines.
The status of the activities from the current project (completed, in progress, and not started) are displayed in comparison to the baseline imported in ScheduleReader and the result is presented in a graphical “Doughnut” chart.
This report is very useful for the project participants because everyone can see how the project is progressing between two consecutive baselines.
The look of the Activity Metrics report is presented in the image below.
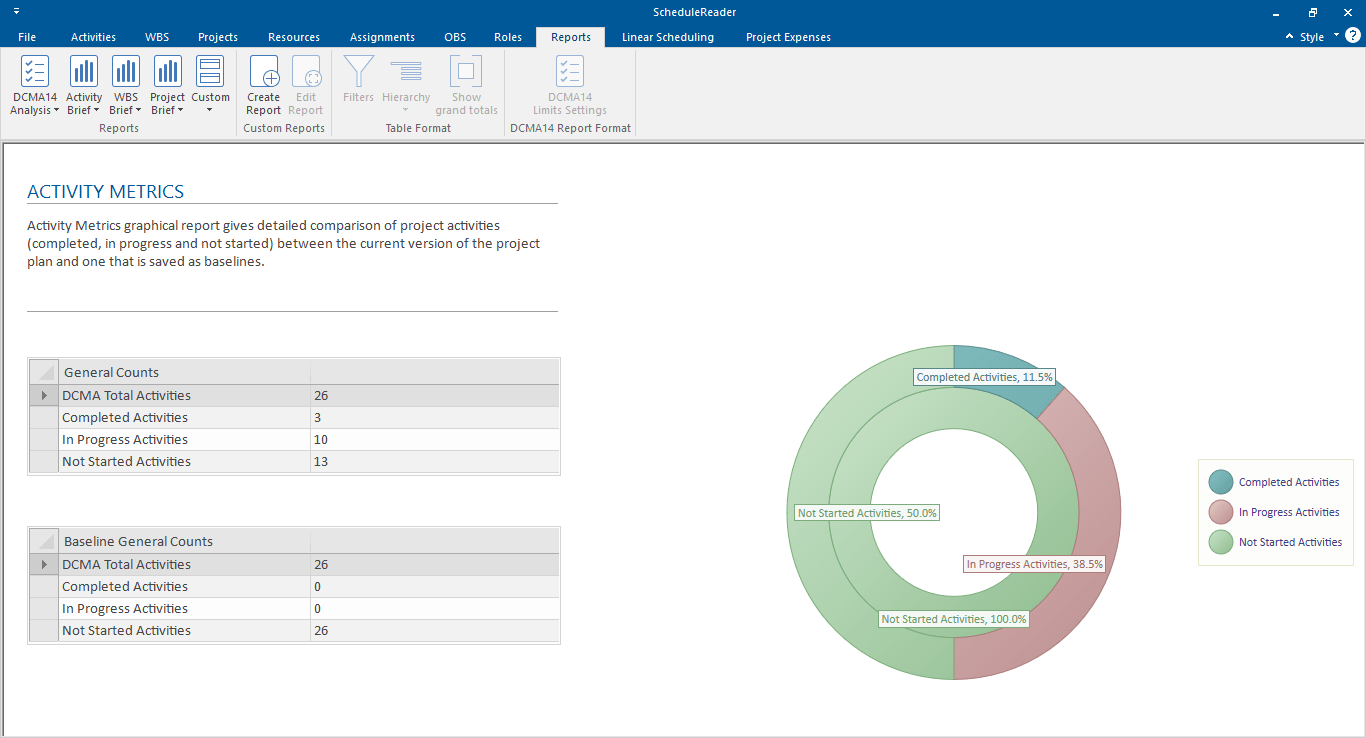
To generate the predefined Activity Metrics Report for your project, select the Reports View, and choose Activity Metrics Report from the DCMA 14 group of Reports.